Blog Post #1
Question/Blog Extension we are going to be going through: Heterogenous Predictive Power of the Economy.
Does the effect of the economy vary when we consider popular vote versus seat share as our outcome (dependent) variable?
Does the predictive power of economy change across time? If so, why?
To begin, this blog post will be dealing with data sets that have been filtered and combined through R. This blog post will be utilizing GDP Quarter 7 data from the midterm years 1962-2018. By my own discretion, I have removed the presidential election years, as the data set does not treat the “president_party” variable as the party going into the election, but rather the victor of the presidential election. Consequently, I felt it would be most beneficial if that was taken out of the equation for this blog post. Additionally, as this class is focused on the 2022 midterms, I hoped to utilize the midterm-only data to guage a better understanding of midterms.
To sort our data, I combined economic data and House of Representatives election data. In addition, we filtered, then mutated the data to create two new variables within our blog: pres_party_seat_share and pres_party_vote_share. The seat share was defined as the # of seats for the president’s party divided by 435 (total # of seats in the U.S. House). This also explains the reasoning behind the year selection, beginning in 1960, as that was the first year in history with 435 House seats (following Hawaii & Alaska’s addition to the United States).
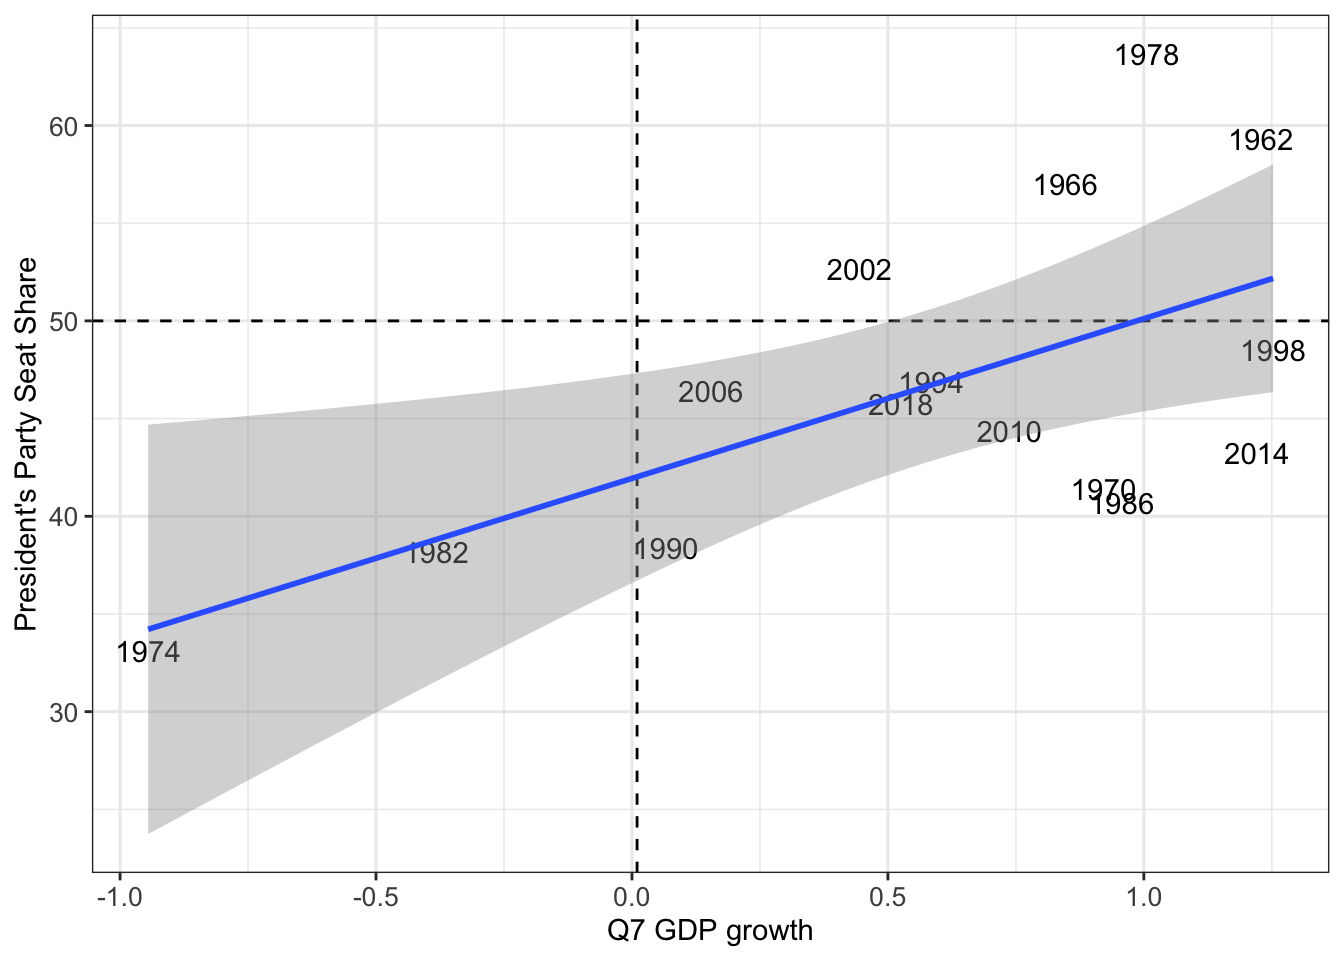 With this data, we first created a scatterplot based on the “Quarter 7 GDP Growth” and “President’s Party Seat Share.” GDP growth in Quarter 7 was chosen as the most recent quarter leading into an election. The expectation was that a recent bump (or lackthereof) in the economy would either benefit/hinder the president’s party in seat share (similar to what we read in Healy and Lenz || & Achens). To test, we formed the scatterplot while placing a linear regression model line on the graph itself.
My personal expectations were that GDP growth would result in president’s party seat share being nearly 50% or above. Unfortunately, the model did not find the GDP growth and party seat share to follow my expectations. There were numerous instances where the president’s party’s seat share was below 50%, despite the GDP growth being around 1% or even more. Whenever the GDP growth was negative, the president’s party never received above 50% of the seat share.
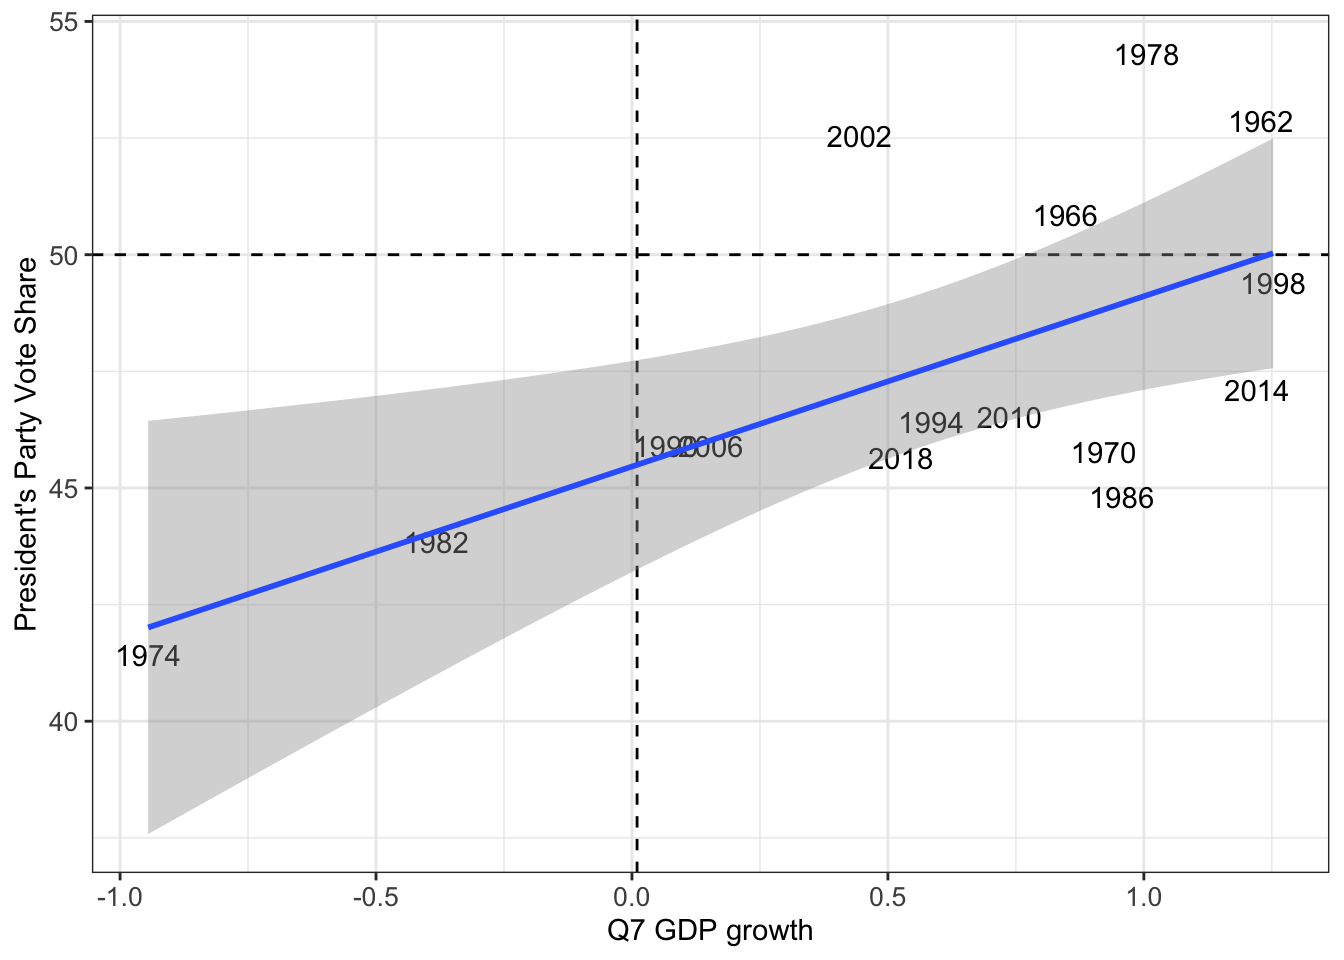 Then, we moved on to see if the president’s party’s vote share was more reflective than seat share, as described by the blog extension. When we ran the model, we did not find it to be particularly accurate, but there were instances (similar to seat share) of accuracy. Again, the economy and seat share relationship did not match expectations to the extent that was originally thought. Though similar to the president’s party seat share, it did reveal that there was not one instance where a president’s party won the majority of the popular vote when GDP growth was negative. This made sense.
Then, we aimed to calculate the actual linear regression number on the GDP growth pct as it relates to president’s party vote vote share & president’s party seat share.
 To begin, we looked at the relationship at a quantified relationship between pres_party_vote_share and GDP_growth_pct. We found the calculation to be 3.65, thus indicating that for every 1% increase in GDP, we can expect the president’s party vote share to increase by 3.65%. I do think this number could be defending in traditional election circumstances, but the 15 midterm years we are utilizing for analysis make me somewhat uncertain about this. If I had the ability, I would use data from past midterms well beyond 1962, given that I had additional time & data.
 We then ran the other calculation. Our calculations found a value of 8.174 between a lm calculation of pres_party_seat_share and GDP_growth_pct. This means that for every 1% increase in GDP, we could expect an 8.17% increase in pres party’s seat share. However, I do not buy this number. This is such a large number that simply does not make much sense in the modern political world. A 1% increase will likely not result in an 8% increase in future elections, especially midterm ones with many more factors than the economy. While an interesting finding, I do not know if I trust it entirely. Similar to above, I would also wish to explore this with additional time & resources.
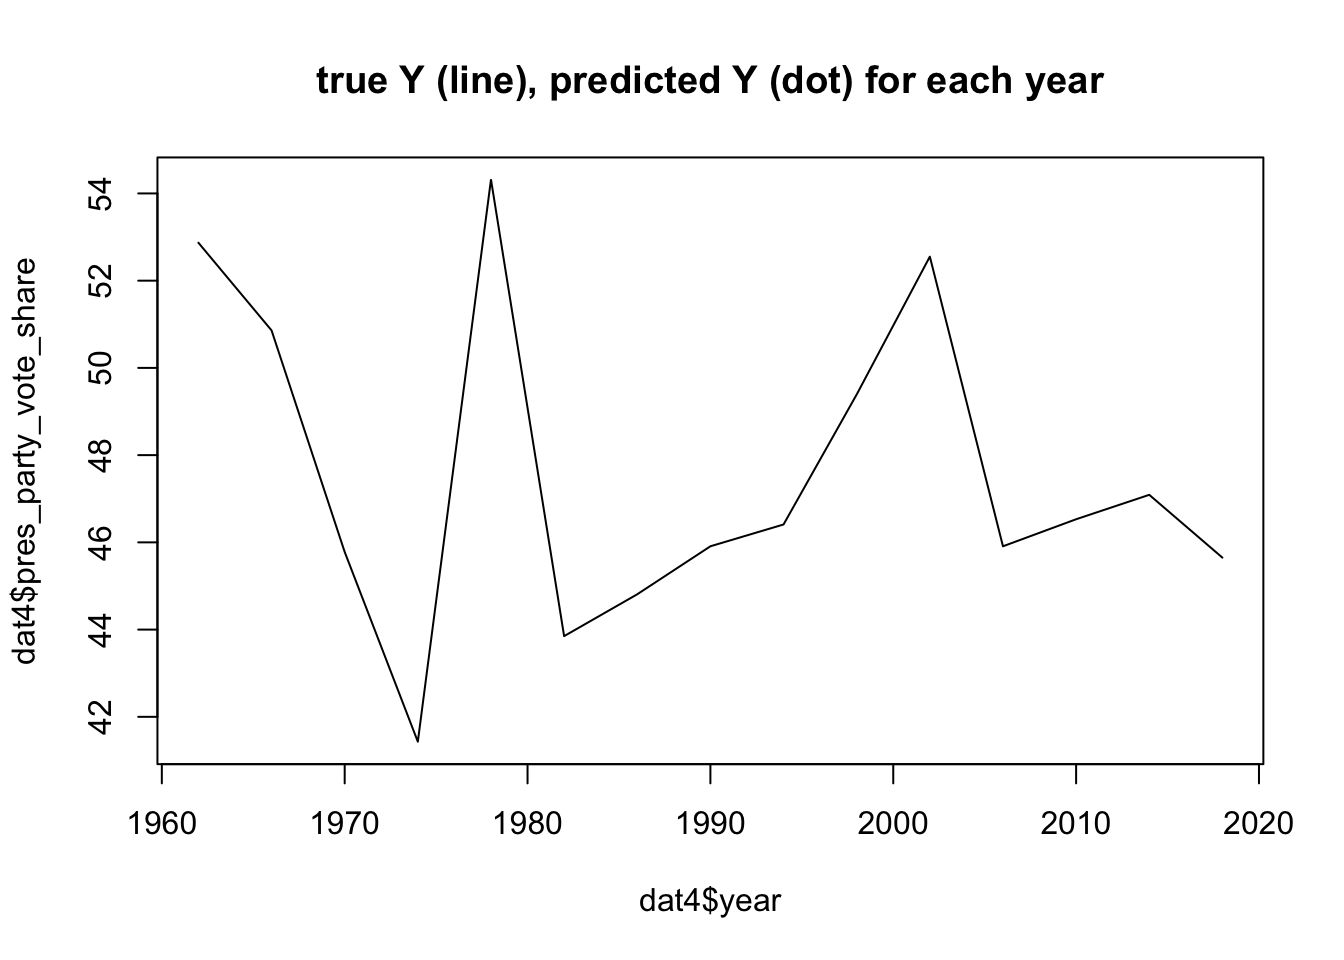
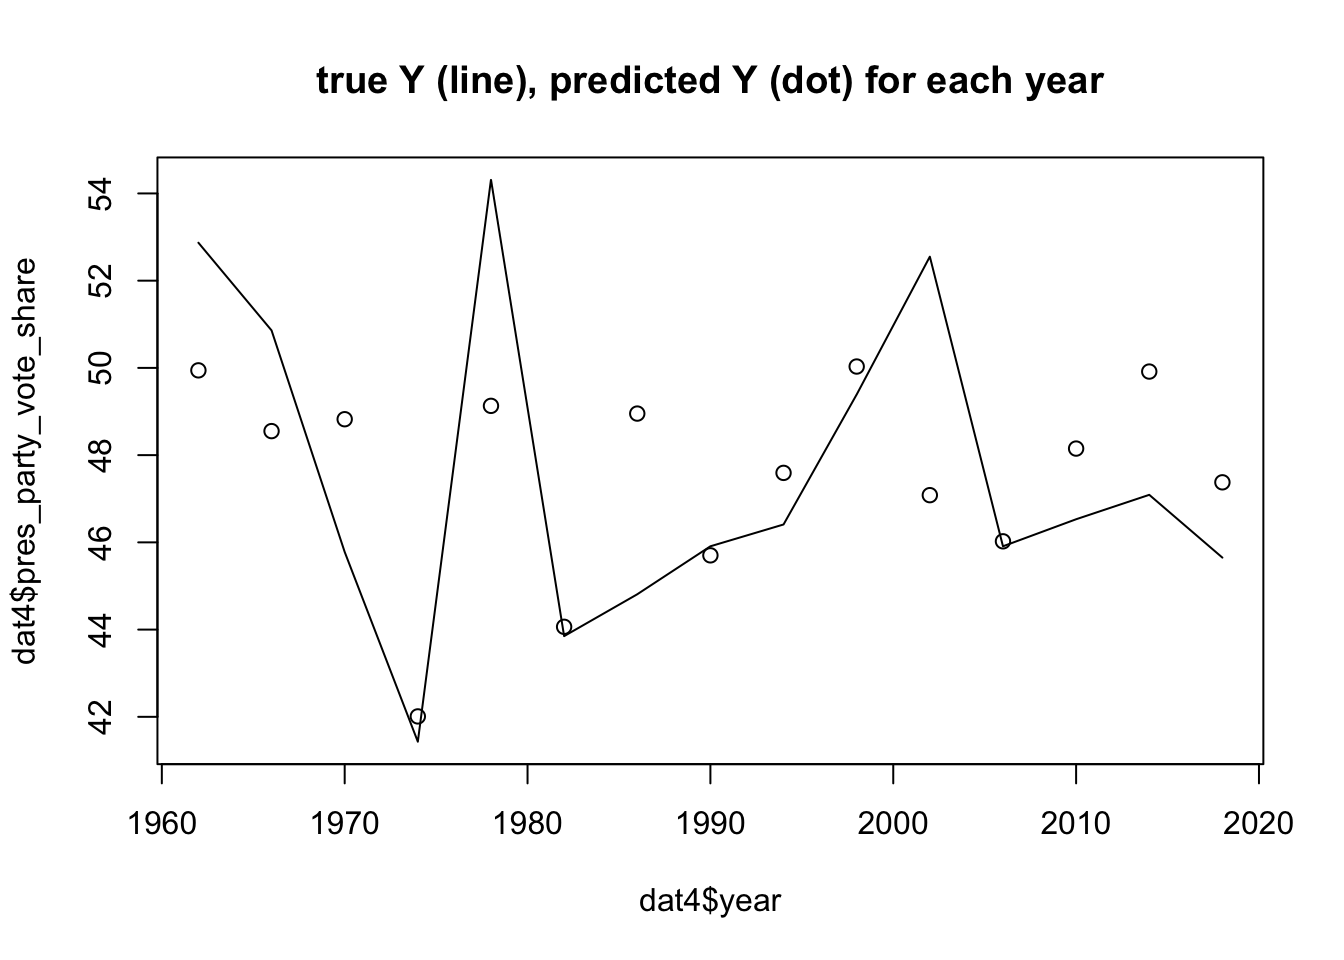

 The second part of this blog extension is to see if there is a change in accuracy over time in these elections. Plainly put: there does not appear to be.
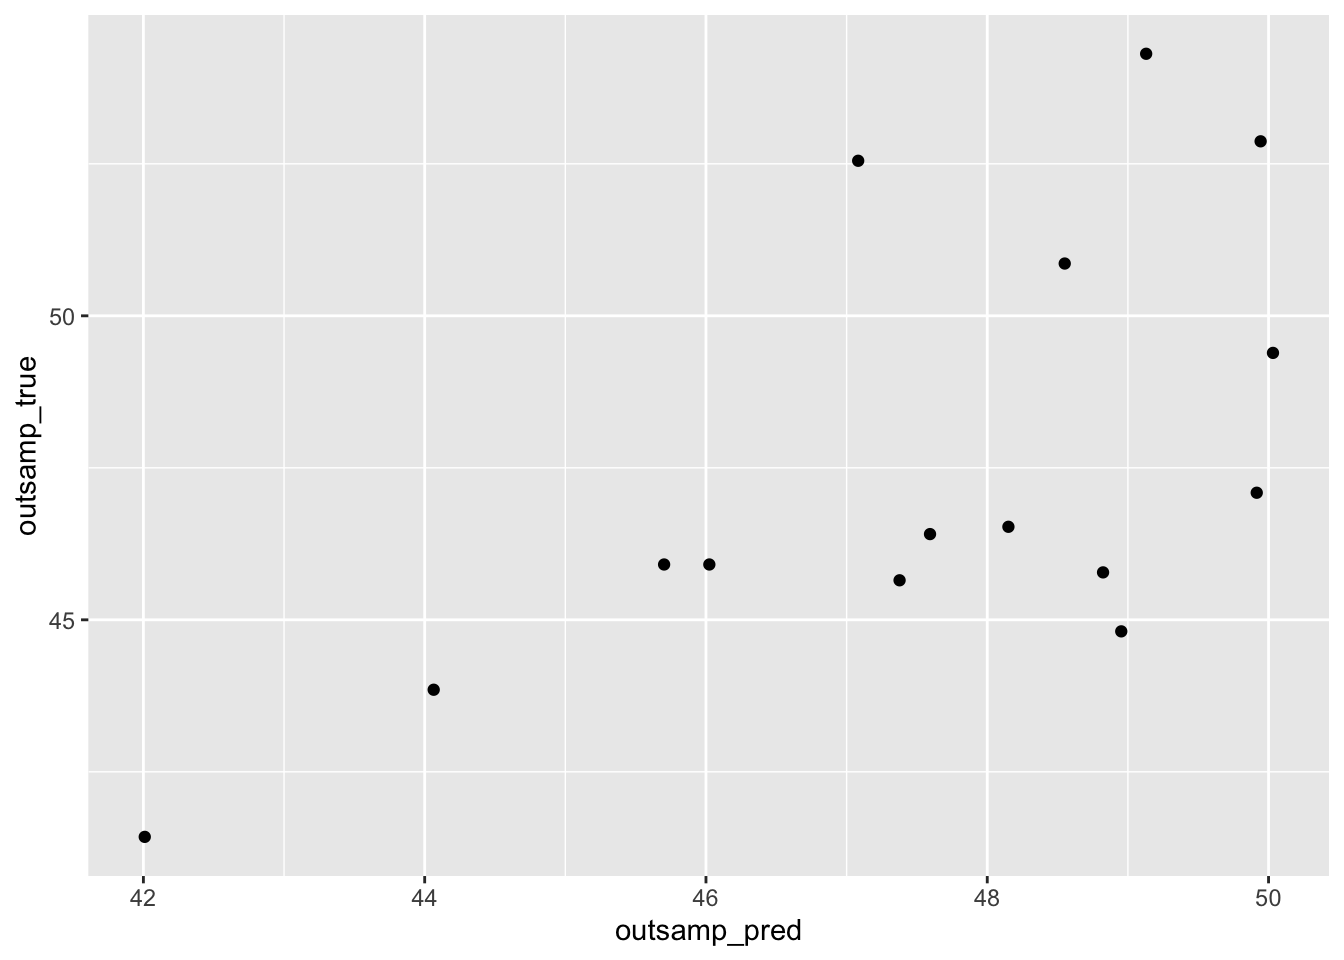
To determine this, we utilized a plot that mapped both a predicted model (based on our data) and the actual model. The party vote share based on actual results vs predicted results did find some spot-on accuracies in the elections of: 1974, 1982, 1990, and 2008. There were also some close calls, but on the overall, it was not nearly as predicitive as it could’ve been. Given the range of accuracy/innacuracies across the time frame, I believe that there is not a significant difference overtime.
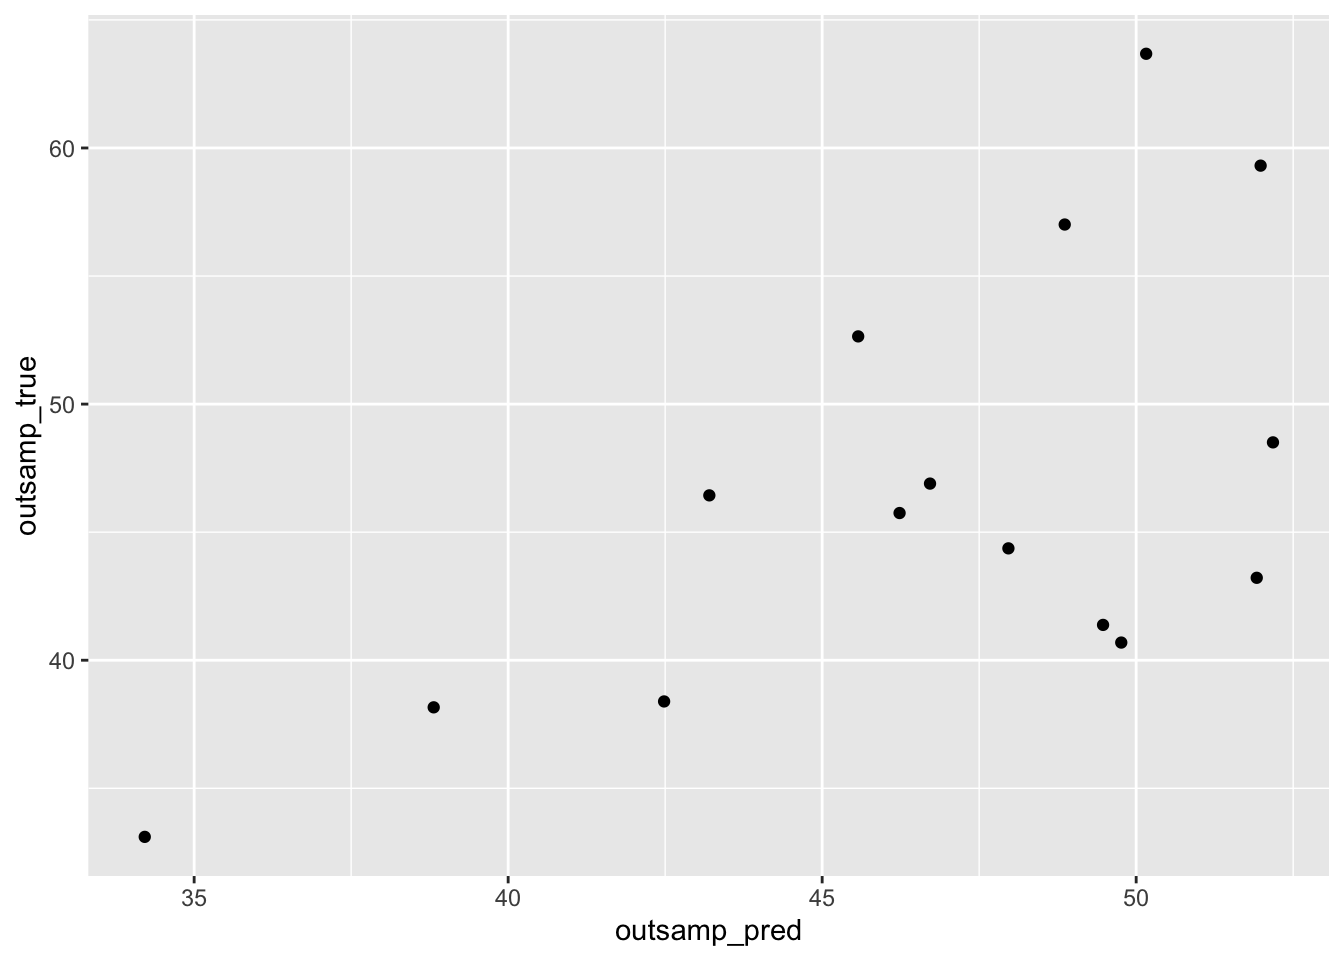
When applying this to seat share, predicted vs actual, there were spot on predictions but also many that missed the mark. Generally, there were not many points of consistent accuracy or consistent inaccuracies, as accuracy was a variety across the board.
Main takeaways: GDP growth does not seem to be the most predicitve/accurate indicator for a president’s seat growth or vote share “It’s the economy, stupid.” may not be as true as we think Time did not help the accuracy/predictive ability of our models
Sources: 1. Achen and Bartels (2017) 2. Healy and Lenz (2014) 3. I did not use Wright as there was no unemployment calculations.
Data being used:
GDP growth (national): 1947-2022 (US Bureau of Economic Analysis, Department of Commerce)
Real disposable income (national): 1959-2022 (US Bureau of Economic Analysis)
Inflation – CPI (national): 1947-2022 (US Bureau of Labor Statistics, Department of Labor)
Unemployment (national): 1948-2022 (US Bureau of Labor Statistics)
Unemployment (state): 1976-2022 (US Bureau of Labor Statistics)
Nelson Bighetti
Professor of Artificial Intelligence
My research interests include distributed robotics, mobile computing and programmable matter.