Blog Post #1
===== Worked with: Claire, Amiel, Jen, Julia & asked Kiara for help =======
In this blog post, we are going to explore the impact of political gerrymandering on the 2020 House of Representative elections. This blog post will contain 2 main graphics: Figure 1. The 2020 Seat Share Margin Across Each State & Figure 2. The 2020 Party Vote Margin Across Each State. The data we utilized has come from 2 main sources: 1. Lab data from the Gov 1347 class & 2. CQ Voting and Elections Collection.
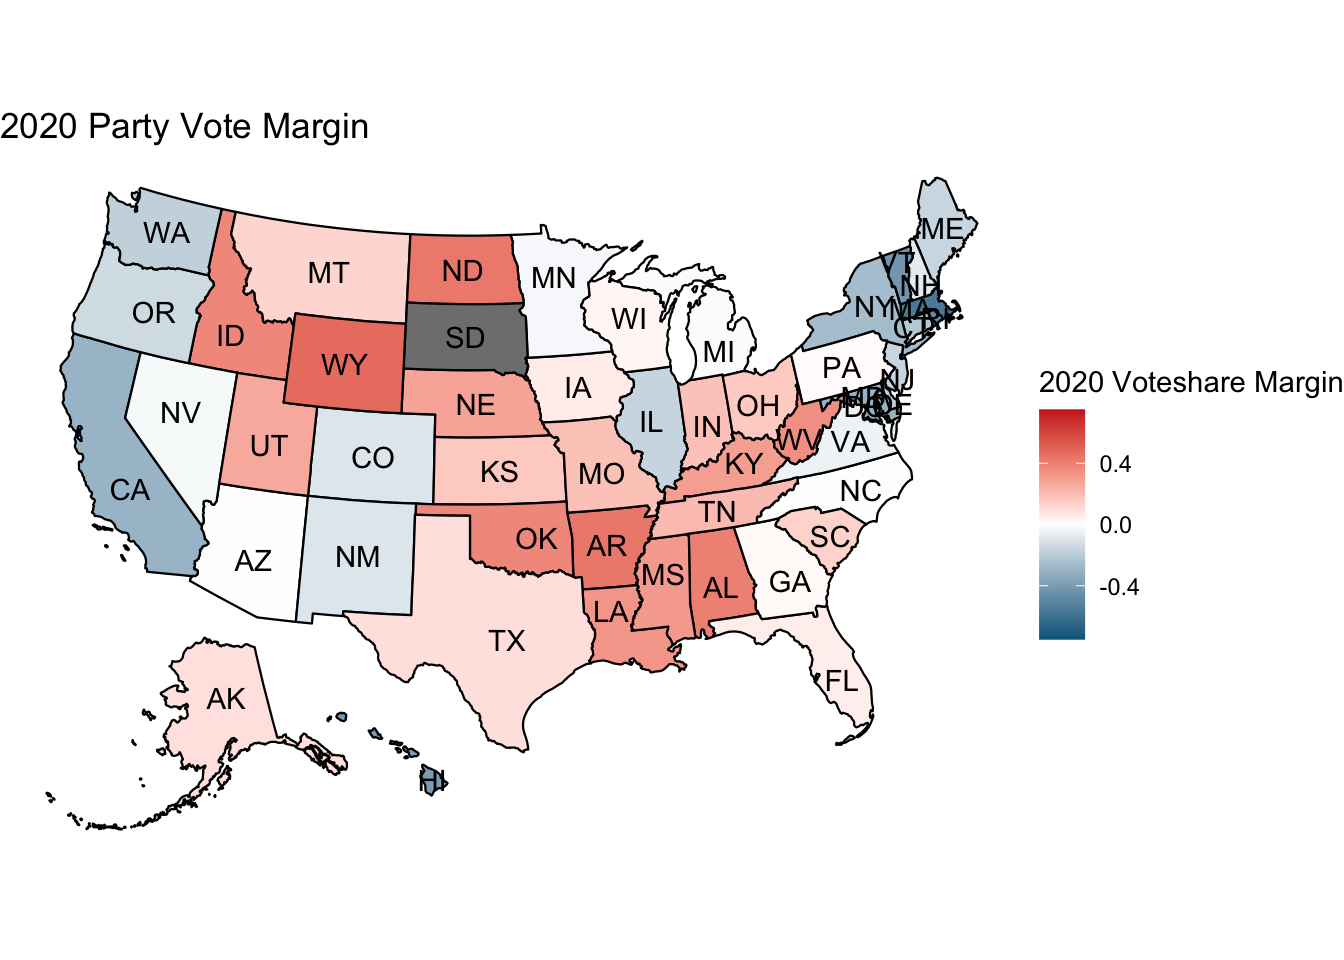 To begin, we will look at the 2020 vote share margin across the country. The party vote share across the majority of states seems quite tame, however that is likely due to the vote share margin being such an expansive (-0.75, 0.75). The reason for the reduction in the vote share margin frame is because it is rare for a party to get anywhere close to 100% more of the vote than their opponents – as a result, I decided to utilize a range that is more possible (75% vote margin). However, you may notice South Dakota to be gray, this is because the Democrats did not run a candidate in 2020. It is fascinating to think about the fact South Dakota had a Democrat in Congress as recently as 2011. Just food for thought
Our vote share map reveals that some states are pretty close by House vote share: NC, VA, GA, FL, AZ, NV, PA, MI, WI, IA, MN, and NH (among others). These, not by coincidence, happened to be swing states in the presidential election that coincided with these House elections. The takeaway from this map is that more-states-than-not are close and competitive on the vote-share side. So… from this, you’d expect it to be similar in terms of House Composition/Seat Share? Right?
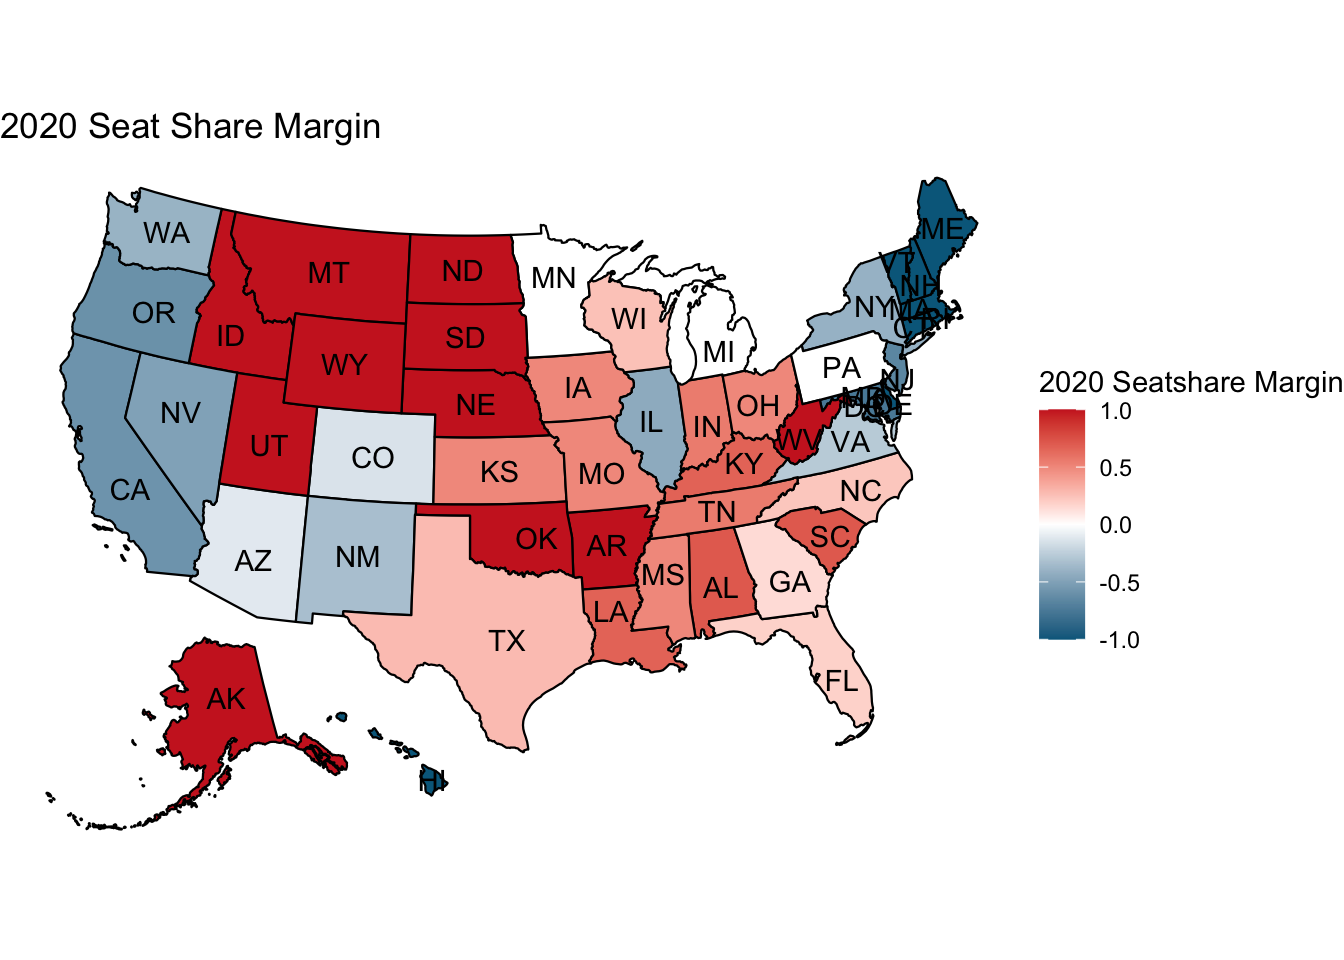 Wrong. When we find the seat share margin map, we find that the majority of states have a extreme partisan compositions, whether that be for Republicans or Democrats. Innocently, we could think that this could be due to simple partisanship, but we saw how few states were truly extremely partisan. For example Maryland–which hasn’t voted for a Republican since 1984 (U.S. Election Atlas)–is heavily blue on our shaded map on both the vote share & seat share map, but this is not the case for many other states. Plainly put: Maryland is an outlier.
Some major differences between vote marign and seat margin can be found in many, many states, but most notably Texas, Ohio, and the worst of all, North Carolina. Texas and Ohio have significantly redder compositions on the Seat Share margin map than on the Party Vote Margin. If you look at the actual party vote margin in Ohio, it is 52R-47D (Ohio Secretary of State Website), compared to the seat composition of 12R-4D (OH SOS). This is a prime example of extreme gerrymandering. Sadly, Ohio is not alone. Texas is another example of partisan gerrymandering, where Republicans won just 9 points more than the Democrats statewide (Texas Secretary of State Website), yet lead them 23-13 (TX SOS) in the House composition. The worst example on the map would have to be North Carolina, where Democrats won the popular vote, yet only won 5/13 House seats in the state. This extreme level of gerrymandering prevented the Democrats from winning a majority in North Carolina.
To clarify some important parts of the seat share margin map: some states have one singular district, meaning that the result will always be one dark color on the seatshare margin map. For instance, Montana has 1 Representative, and though Republicans won by less than 15%, it still went to them, thus marking the map as solid red. To not confuse single-district states with gerrymandered ones, here are the single-district states in the United States (pre-2022 Redistricting Era): AK, DE, MT, ND, SD, VT, and WY.
In conclusion, I could write on and on about the abundance of evidence of gerrymandering through our maps, but it would be ultimately be redundant. To wrap up, there are two main takeaways that this blog post has revealed: 1. Republicans gerrymander better than Democrats – or at least, have more gerrymandered states than Democrats, likely due to their heavy levels of victories back in 2010 (see: 2010 Election Results) – and it shows. & 2. Vote share and seat share does align in some states, showcasing that our system is not entirely screwed up.
Altogether, our political system in the House of Representatives needs work to ensure fair representation. However, based on how engrained gerrymandering is in American political culture – I am far from hopeful.
Nelson Bighetti
Professor of Artificial Intelligence
My research interests include distributed robotics, mobile computing and programmable matter.