Blog Post #3 - Polling in America
Throughout the 21st Century, political punditry and forecasing has been paramount to understanding our national, political environment. Forecasters have used a variety of methods to pinpoint and predict the outcome of future elections. With a significant, recent rise in data analysis, horserace polling, and punditry, election forecasting has risen in popularity as well. Websites such as FiveThirtyEight & the Economist have begun to publish reoccurring election forecasts, depending on the election year. Whether a midterm or presidential election, these sites provide predictions and estimations for both sides of aisle–-backed up by data and statistics.
To accurately predict an election, however, pundits rely heavily on public, non-partisan polls to fuel their predictions. Polls are typically regarded as the single, most important predictor in any election–at least until 2016. In 2016, the polls were significantly off, dramatically reducing trust in the polling industry. As we move into the 2022 midterm elections, the apprehension behind polls is still apparent, though recent sucesses in 2018 & 2020 have quelled some fears.
As mentioned above, FiveThirtyEight is a forecasting company that churns out election forecasts in every midterm & presdiential election post-2010, ran by Nate Silver. In their model, they hold many factors to be important in their modeling: basic partisanship, errors found in race-to-race, likely voters, timeline adjustment, house effects adjustment, and present-day issues (such as COVID-19’s impact on voting). They weigh these models using different measures depending on what is most important and accurate within predicting. However, there are significant factors that guide FiveThirtyEight’s forecast towards the right and left wing. These are what we call “fundamentals.” Fundamentals are factors beyond polling that contribute to the race’s outcome.
Fundamentals can include: an incumbent’s margin of victory in past elections, fundraising, 538’s partisan lean, congressional approval, scandals, voting record, and a challenger’s quality. These factors aide in the decision-making process in FiveThirtyEight’s model, with an emphasis on incumbency (+ performance) and generic ballot polling data. Additionally, FiveThirtyEight utilizes 3 different models for their predictions: Lite (polling + CANTOR), Classic (include fundamentals), Deluxe (include expert forecasts). They weigh their polls & adjust it based on time frame–providing a more accurate prediction.
G. Elliot Morris runs The Economist’s forecast for elections, relying heavily on their own fundamentals and indicators for their predictions. As we are focused on Congressional (House) elections for 2022, we will be looking at Morris & The Economist’s House Fundamentals: partisan voting history, campaign fundraising, and other factors, similar to FiveThirtyEight. Of course, they utilize the generic ballot as well for their overall indicators. The generic ballot is a shared trait through nearly all pundits and forecasters, as it is a considerable indicator of public support and sentiment towards both parties. We also find that The Economist uses district-level data as part of their fundamentals – FiveThirtyEight does something similar, but it we find both models are hyper-specific. As noted in their 2018 model, The Economist uses a Skew-T distribution.
As for predictions on the presidential level, The Economist uses economic data (GDP), presidential approval, and more. This data serves as The Economist’s “fundamentals,” as the coined term in FiveThirtyEight’s forecast. Overall, The Economist finds itself weighing similar to FiveThirtyEight (and other forecasters… see DecisionDeskHQ, RaceToTheWhiteHouse, etc.). Though, they have their differences when it comes to weighting and decision-making behind factors to include in their predictions.
Between the two, I would preference FiveThirtyEight over The Economist. While I do believe that both are relatively accurate forecasters, FiveThirtyEight seems to take into consideration more factors than The Economist. Just through a simple look through of their websites, FiveThirtyEight has more interactive portions of their model that provides the viewer a better understanding of their predictions. Additionally, I prefer the 3 levels of modelling to help compare & contrast predictions from Lite, Classic, and Deluxe. Having the different levels helps me understand the impact of solely polling, then fundamentals included, then finally, expert forecasts.
In this blog post, we will be utilizing a FiveThirtyEight strategy to understanding the impact of polling & the economy on the midterm elections.
To begin, we will explore the generic ballot final numbers in November and compare it to the actual results of the midterm election. For this blog post, we will be exploring “Incumbent Party Vote Share.”
Generic Ballot Value vs Actual Over Time
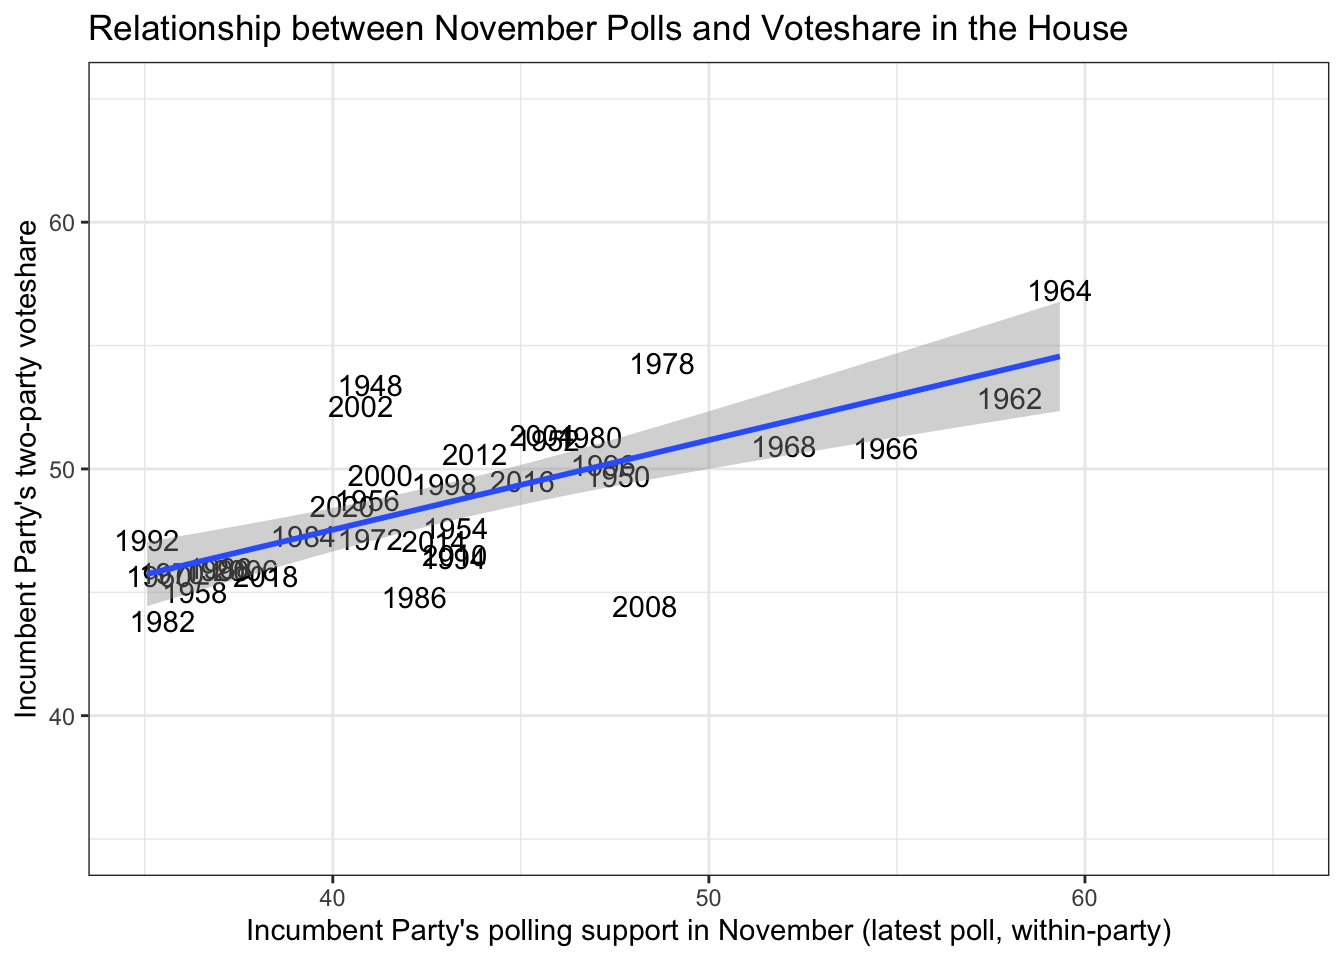
In the above graph, we find that there is a correlation between November polling data & final results for political parties. The question is… how strong is the correlation? To find this, we calculated the linear regression model of the relationship between incumbent president’s party vote & the incumbent president’s party polls in November, we find the R squared value to be 0.5843. This reveals we have a moderate relationship between the two variables, thus making the November polls a somewhat accurate predictor of the actual election.
Following our finding of this moderate relationship, we decided to predict the 2022 midterms based on the Democratic Party’s current numbers in the FiveThirtyEight generic ballot. To set up this prediction, we used the model that formed the above graph, and included a new data frame of the Democratic Party’s numbers as of right now. The current D Party vote share in the generic ballot is 45.3%, and thus, we will use that as our input to predict the actual Democratic Party vote share. When using the model & the new input, we find our prediction to put the Democrats at 49.42% for the 2022 vote-share. This is an under performance from their popular vote share from 2018 & 2020, which we can likely conclude results in a democratic loss in the House this November.
Now, we will look at the economy.
Moving onto Economic Impacts
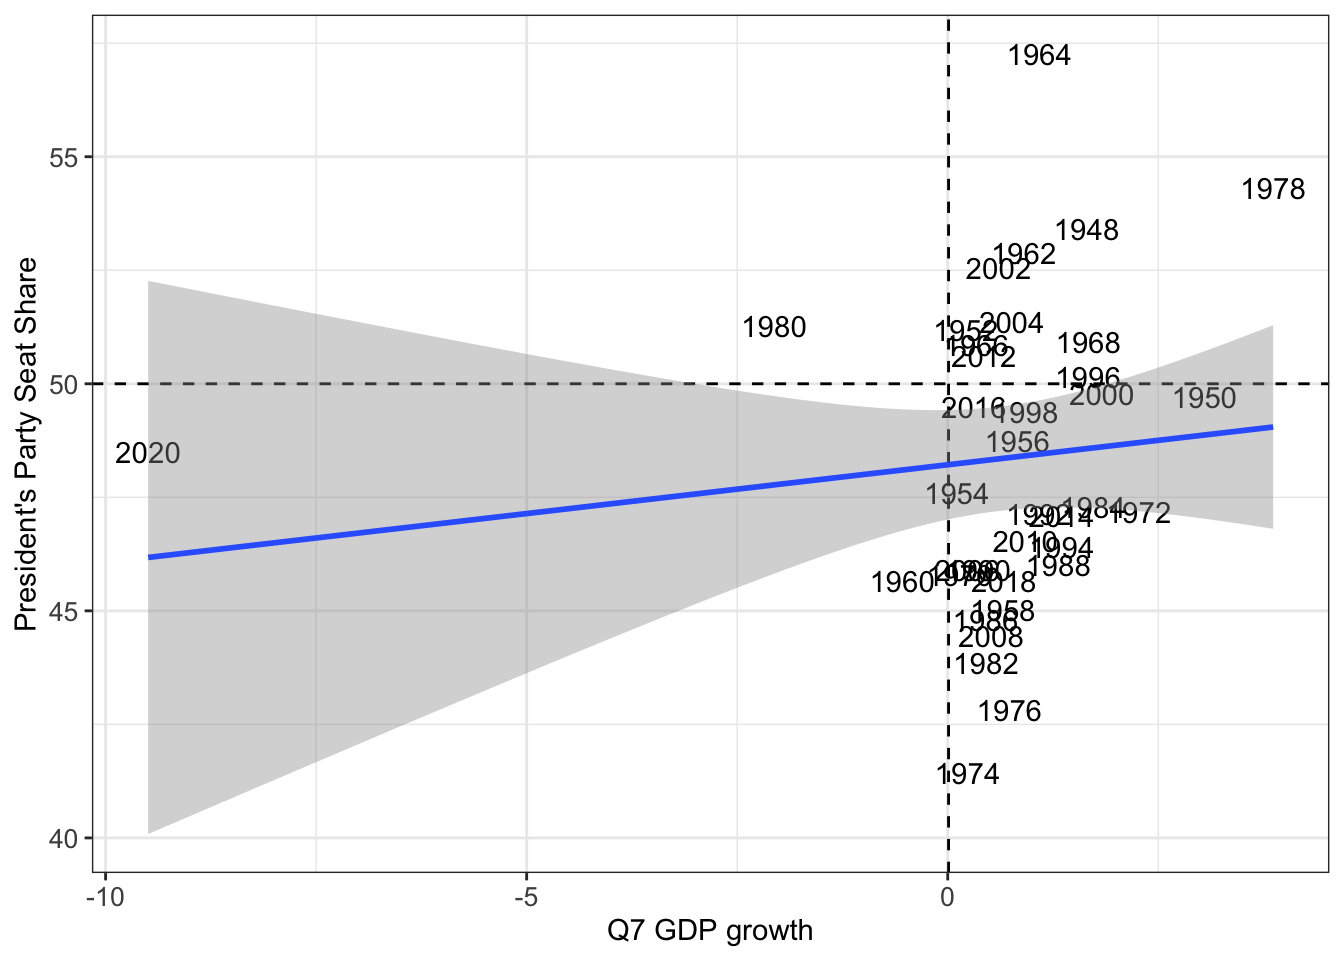 To use economic data, I decided to use GDP growth in the 2nd quarter of the year, to help us better match where the 2022 midterms currently are. Based on the 2nd quarter GDP growth, we created a linear regression model of the relationship between that same GDP growth percentage & the incumbent president’s vote share. In addition to the linear regression model, we created a graph to show the relationship between the variables. In both the visual & calculated linear regression R^2 value, we found no correlation between the two.
The R-squared value was -0.012, and thus, is actually predicting worse than a standard line. As a result, we likely cannot rely on GDP growth as a means of predicting the midterm elections, as it does us a disservice. However, for the sake of it, we will calculate the expectation for Democrats based on the 2022 Quarter 2’s GDP growth (-0.9%). With this number, the model predicts Democrats will have 48.02% of the vote share. The economy can serve as an equivalent to one of FiveThrityEight’s “fundamentals.”
Finally, we will combine both factors.
Combined Economic + Polling Model
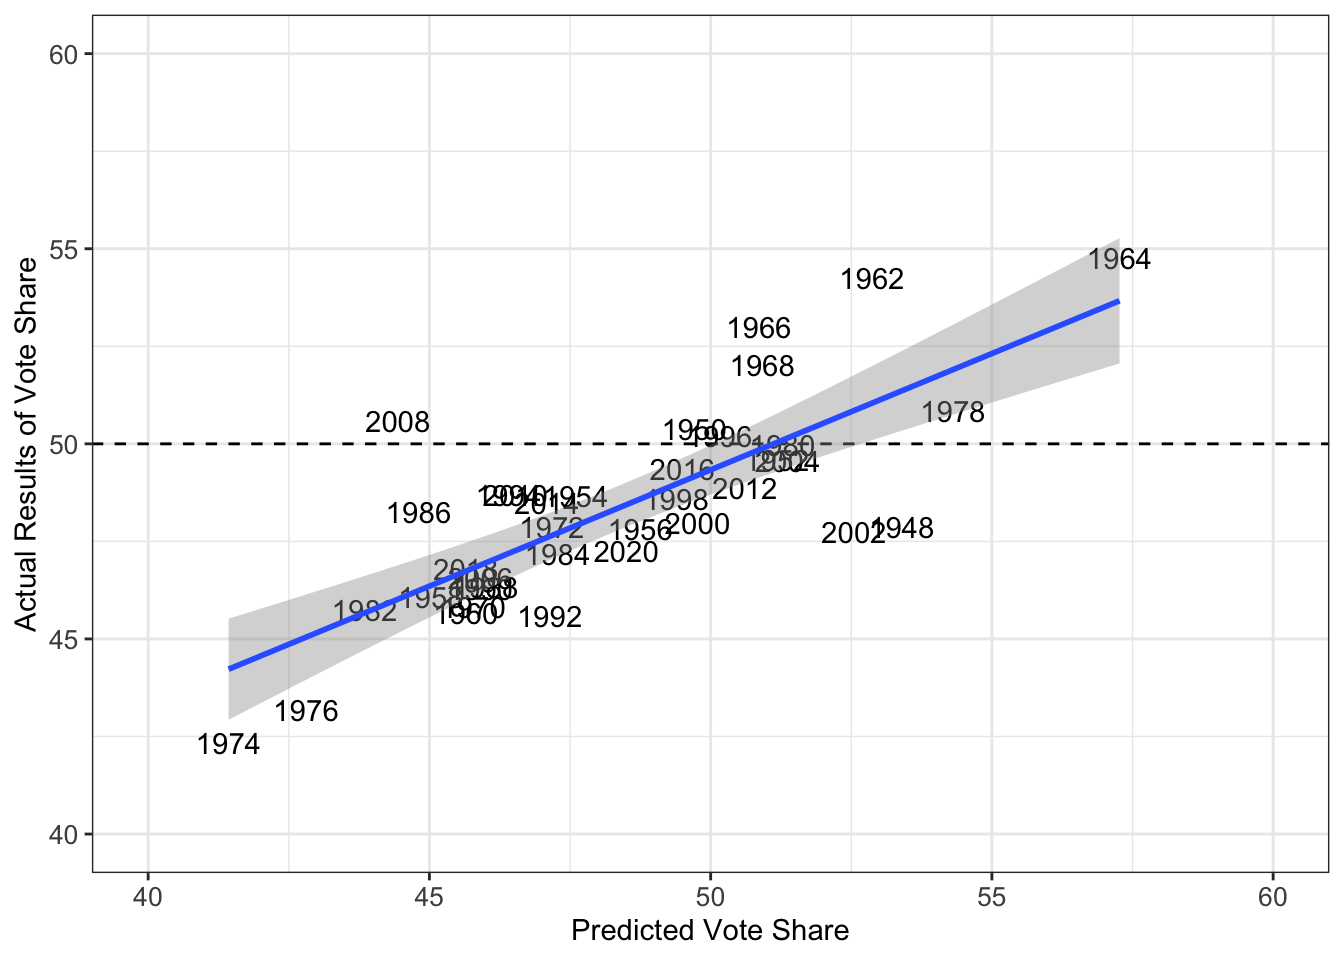 After combining both factors, we found the strength to return to a moderate correlation. The R-squared value was found to be 0.57, but this is largely led by the relationship between polling and actual numbers, rather than GDP. Having less of an R-squared value with BOTH variables added in than with JUST polling likely indicates GDP growth was detrimental to my model. In this combined model, it found that the Democratic Party’s expected vote share is 49.37%, not too far off either of the other models. However, I have some difficulty trusting the combined model, as GDP growth is certainly not the best variable for predicting the midterms.
In conclusion, we have 3 main takeaways from this blog post: 1. Polls in November are pretty good at predicting the actual vote share in the election 2. GDP growth in quarter 2 isn’t good at predicting the actual vote share in the election 3. Democrats still likely lose the House based on all 3 of the models created
As we move forward, I am looking to change my economic variables to make the model more accurate, or consider entirely scrapping it from the final model.
Thank you for reading :)
Nelson Bighetti
Professor of Artificial Intelligence
My research interests include distributed robotics, mobile computing and programmable matter.