Blog Post #4 - Predictions/Forecasts
Expert predictions have been around in election analytics for decades. Predictions of election results have become a new market for various news agencies & websites to gain fame and popularity over correct predictions. Predictions also help inform an electorate of how a race may end up, well before the results are actually in. In the case of this blog post, we are going to be specifically focused on the 2018 midterm elections; we will be exploring the accuracy of the political pundits & what it means for competitive seats in these upcomimg November midterms (2022).
In this blog, we will be focused on mostly swing/competitive districts for 2022, as described in our data sets. This data will be helpful to explore how accurate or inaccurate some of these experts are at forecasting the race. To narrow our field even more, we will only be utilizing the expert ratings from Inside Elections, Cook Political Report, and Larry Sabato’s Crystal Ball. Interestingly enough, I have actually met one of the leads at the Sabato Crystal Ball & spoke with Dave Wasserman, a head at the Cook Political Report. These are trustworthy forecasters, some of which have nailed past midterms & presidential elections; thus, my intial expectation for the upcoming midterms is that these predictions will be very accurate.
Additionally, this blog post utilizes a numeric system for ratings, from 1-7. 1 being the safest for the DEMOCRATIC PARTY & 7 being the safest for the REPUBLICAN PARTY. Some ratings in the data set utilize a 9-point scale (traditionally, most use 7), as a result of the inclusion of a new characterization: tilt. However, the dataset accounts for that & has scaled it to work within a 7 point scale. To my knowledge, only Inside Elections uses tilt for House ratings, whereas Cook & Sabato use (only) lean, likely, and safe/solid.
Beginning my code
Before we begin, we should model the map of the 2018 midterm elections by Democratic Party voteshare on a district-by-district map. We utilized shape files from the University of California, Los Angeles, to help model our map.
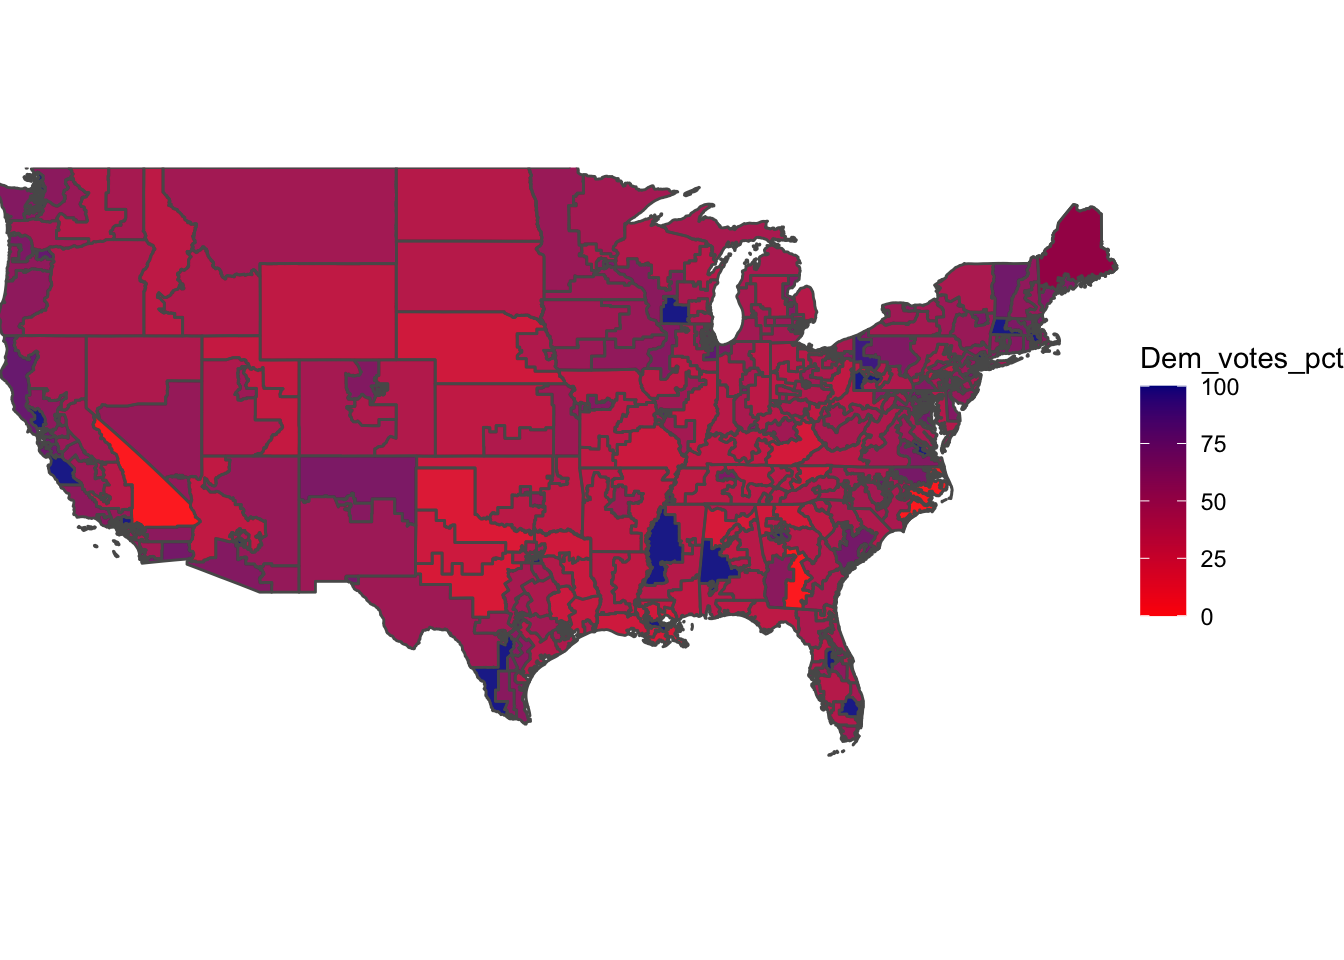
We are going to compare the map above to what the expert ratings had to say for the map. Unfortunately, we had to cut out Alaska & Hawaii, as it would competely warp our map & make other parts of the map unrecognizable. This means we are modeling 3 less seats than would be traditionally modeled, should Alaska & Hawaii be included. As you can see based on the above map, there are STRONG Democratic pockets across the country, even some with nearly 100% of the vote going towards a Democrat. This is the case in uncontested house seats, where Democrats hold strong & Republicans have no chance at victory. Vice-versa with super bright RED districts, indicating a near 100% victory for the Republican there. Overall though, we see where purple & stronger Democratic share lies, especially on the East & West Coasts, but still support for Democrats throughout the nation.
Below is the map of the 2018 midterms based on expert prediction.
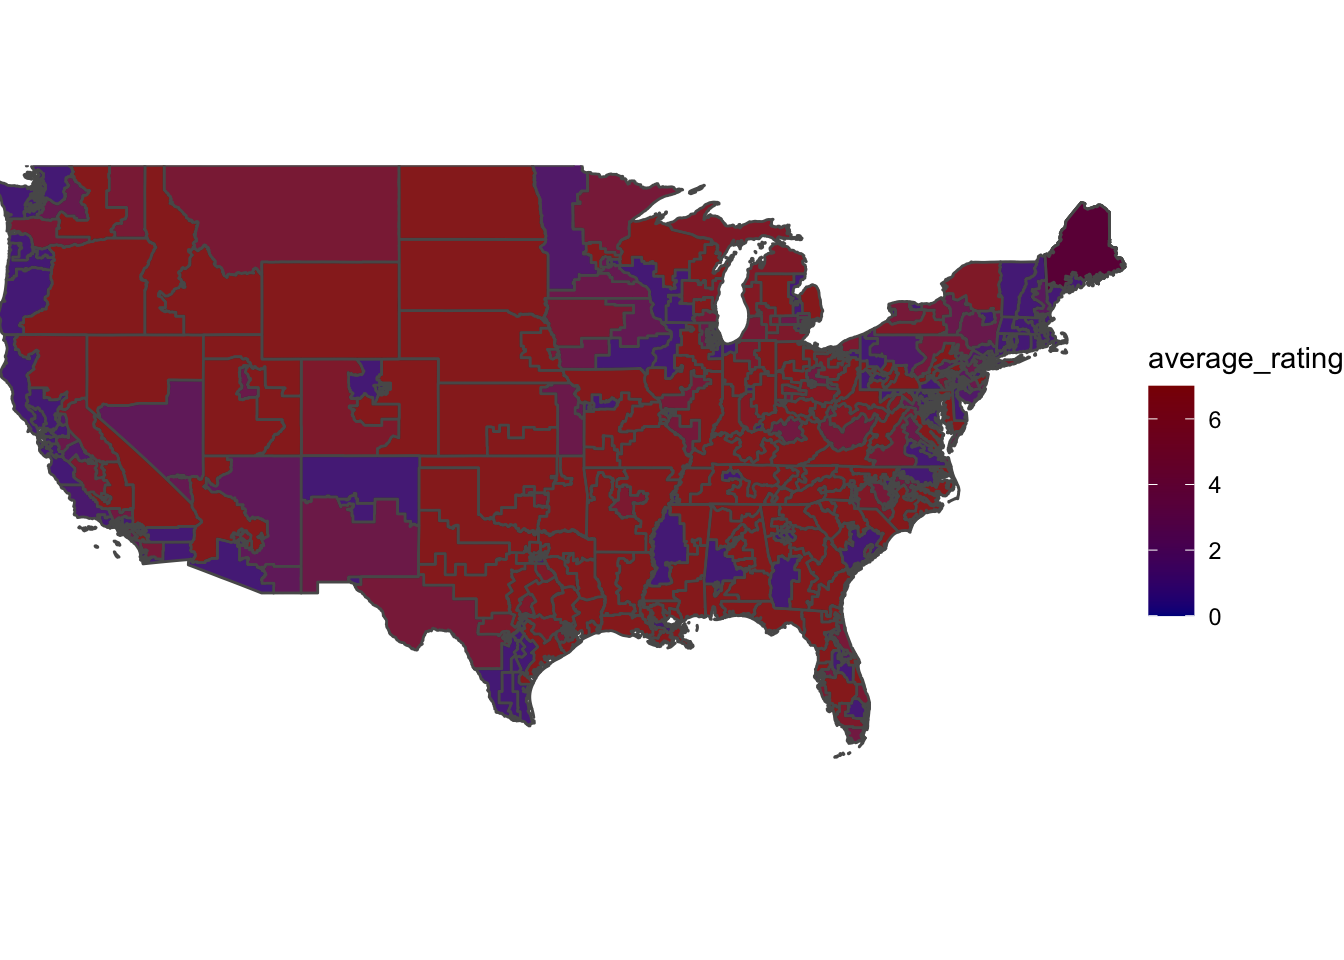 I chose different colors as the range of numbers for the ratings was 0-7, not 0-100 (like the map above this one). This made more sense for visualization & was a good way to track the two different maps.
To quantify the R^2 value between expert predictions & Democratic Party vote share, I decided to run the lineral regression model to find my number.
I began launching my code by sorting out the expert ratings for the 3 forecasters (will be referred to as CSI for the remainder of the blog post). I started by following a prediction based strictly on 2018’s forecast accuracy.
I created a new dataset called “new_train_data_2018”, combining my data sets of the Democratic Party’s vote share in districts & the CSI ratings, all from 2018. This allowed me to use this as my baseline data & run a model to find the correlation between expert prediction and Democratic Vote share.
The R^2 value was 0.8118 & told me there was a significant connection between the Democratic Party’s vote share & expert ratings. It showed above average accuracy & told me that I could trust my Big 3: Cook Political Report, Larry Sabato’s Crystal Ball, and Inside Elections. Using the 2018 accuracy, I decided to put my CSI to the test in predicting the 2022 midterms.
Quick reminder: we are only predicting the “competitive” seats as outlined in the dataset. Here are the 2022 predictions:
## # A tibble: 141 × 8
##     year state     district sabatos_crystal…  cook rothenberg avg_csi prediction
##    <dbl> <chr>     <chr>               <dbl> <dbl>      <dbl>   <dbl>      <dbl>
##  1  2022 Alaska    AL                      4     4       4.75    4.25       50.4
##  2  2022 Arizona   1                       5     4       5.5     4.83       48.9
##  3  2022 Arizona   2                       5     5       5.5     5.17       48.1
##  4  2022 Arizona   4                       3     2       1.75    2.25       55.4
##  5  2022 Arizona   6                       5     5       4.75    4.92       48.7
##  6  2022 Californ… 3                       6     6       6.25    6.08       45.8
##  7  2022 Californ… 6                       1     1       1       1          58.5
##  8  2022 Californ… 9                       3     3       1.75    2.58       54.6
##  9  2022 Californ… 13                      4     4       2.5     3.5        52.3
## 10  2022 Californ… 21                      2     1       1       1.33       57.7
## # … with 131 more rows
To make things better, I decided to take into account CSI data & accuracy for 2010 through 2018. This meant repeating the above (for 2018), but including 4 more elections! How exciting!
We calculated the R^2 value of the 2010-2018 connection between prediction & Democratic Party vote share & found it to be 0.7. Not as correlated as 2018, but still pretty good. Then, we calculated 2022 predictions based on 2010-2018 accuracy.
Here it is:
## # A tibble: 141 × 8
##     year state     district sabatos_crystal…  cook rothenberg avg_csi prediction
##    <dbl> <chr>     <chr>               <dbl> <dbl>      <dbl>   <dbl>      <dbl>
##  1  2022 Alaska    AL                      4     4       4.75    4.25       48.1
##  2  2022 Arizona   1                       5     4       5.5     4.83       46.5
##  3  2022 Arizona   2                       5     5       5.5     5.17       45.6
##  4  2022 Arizona   4                       3     2       1.75    2.25       53.5
##  5  2022 Arizona   6                       5     5       4.75    4.92       46.3
##  6  2022 Californ… 3                       6     6       6.25    6.08       43.1
##  7  2022 Californ… 6                       1     1       1       1          56.9
##  8  2022 Californ… 9                       3     3       1.75    2.58       52.6
##  9  2022 Californ… 13                      4     4       2.5     3.5        50.2
## 10  2022 Californ… 21                      2     1       1       1.33       56.0
## # … with 131 more rows
Overall, we found that the CSI ratings held up to be pretty good indicators of House elections, especially 2018. I am personally pleased by the result we have seen, but am unsure if I will be including expert ratings in my final forecast. I do think they could help, but I’m deliberating between a FiveThirtyEight-style forecast (in this case, I’d include the expert ratings), or a 2-3 factor model to see if I can accurately predict the midterms without utilizing all variables. Though, this blog post was quite fun, and added a lot to my personal understanding of the connections between punditry and results.
Thanks for reading :)
Nelson Bighetti
Professor of Artificial Intelligence
My research interests include distributed robotics, mobile computing and programmable matter.