Blog Post #7
== Final Blog Post Before Midterm Prediction ==
This blog post will be the final one held before the Midterm Elections. We are in quite an exciting time as we enter into November 2022 – my next blog post will ultimately be my final prediction. As it stands currently, the Democrats are losing on the national popular vote (FiveThirtyEight + RealClearPolitics polls), they are losing in expert forecasts (in the House + nearly in the Senate), and this blog post will be focused on one thing: updating my 2022 model.
This week’s blog extension gave the opportunity to work on updating my statistical model – and thus, I wanted to use this opportunity to predict the 2022 House Elections given the 2018 midterm elections. Previously, I had explored the accuracy of the 2018 midterms as it pertained to predictions from 2018 (I used the data to predict itself), but now, we will be moving up a level.
To begin, we will start by modeling the accuracy of the 2018 & 2020 expert predictions + 2018 & 2020 results!
## `geom_smooth()` using formula 'y ~ x'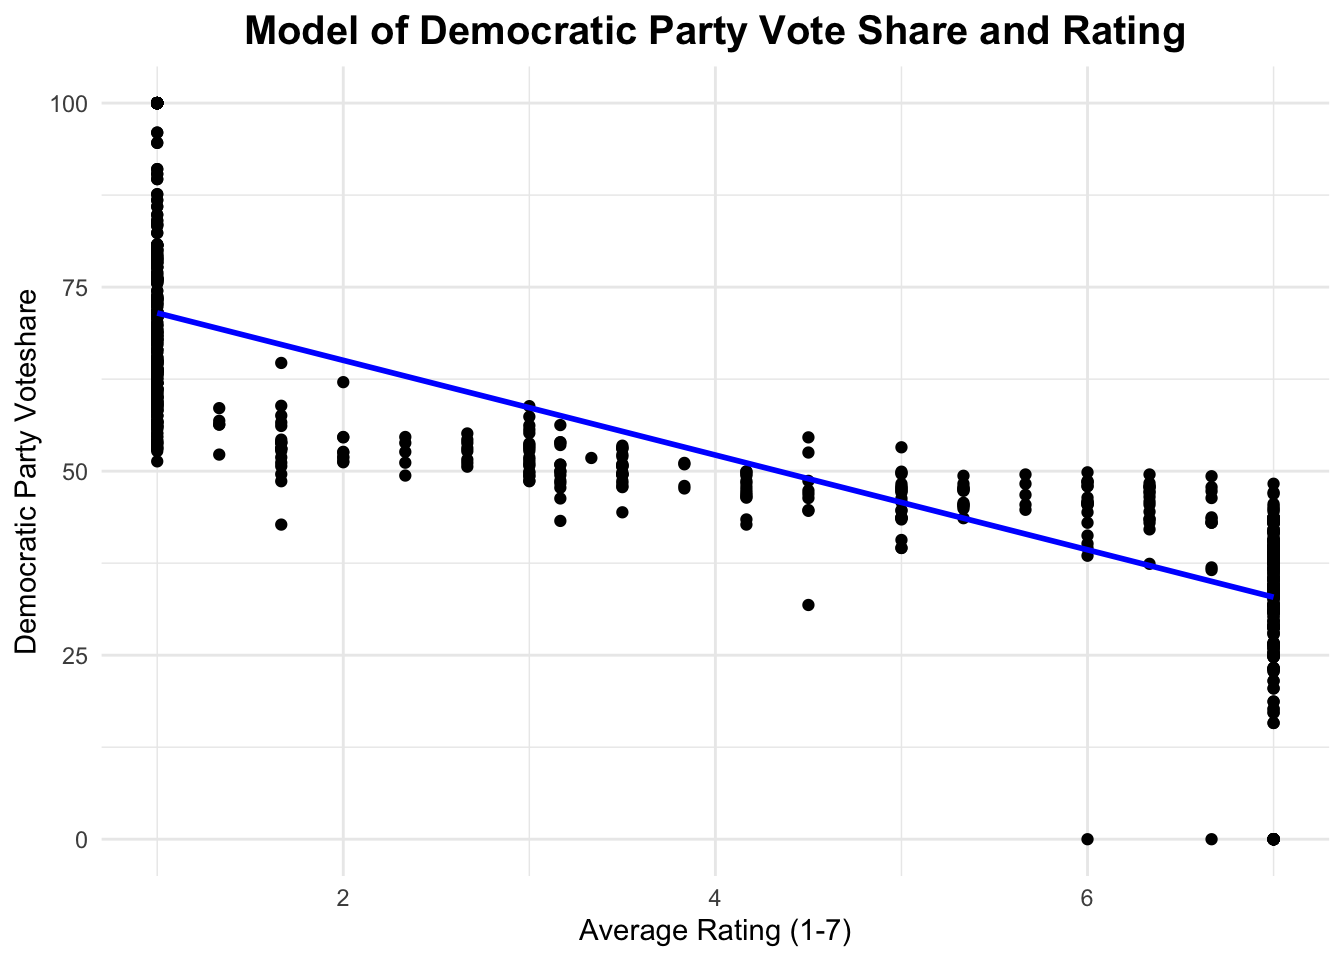 What we find here is that there seems to be a clear, visual, correlation between the rating & the Democratic Party’s vote share. The Democrats do significantly better when the rating is around 1, which checks out, and significantly worse when the rating is around 7, which also makes sense. Altogether, we find that this usage of comparing rating vs. Democratic Party vote share should work as a predictor for the 2022 midterms.
Now, we are going to include the 2022 midterm elections, in which the model will not be utilizing a pooled model – this is strictly based on the 2018 & 2020 expert ratings + final results. In our predictive model, we will only be provided with the expert ratings for each individual house district. We are pivoting to a prediction for the midterms given the extremely close nature of the November elections. This will tremendously help in figuring out my final prediction.
Now, let’s move into predicting the 2022 midterms based on the 2018, 2020 election results.
== 2022 Prediction ==
## group value
## 1 Republican 212
## 2 Democrat 223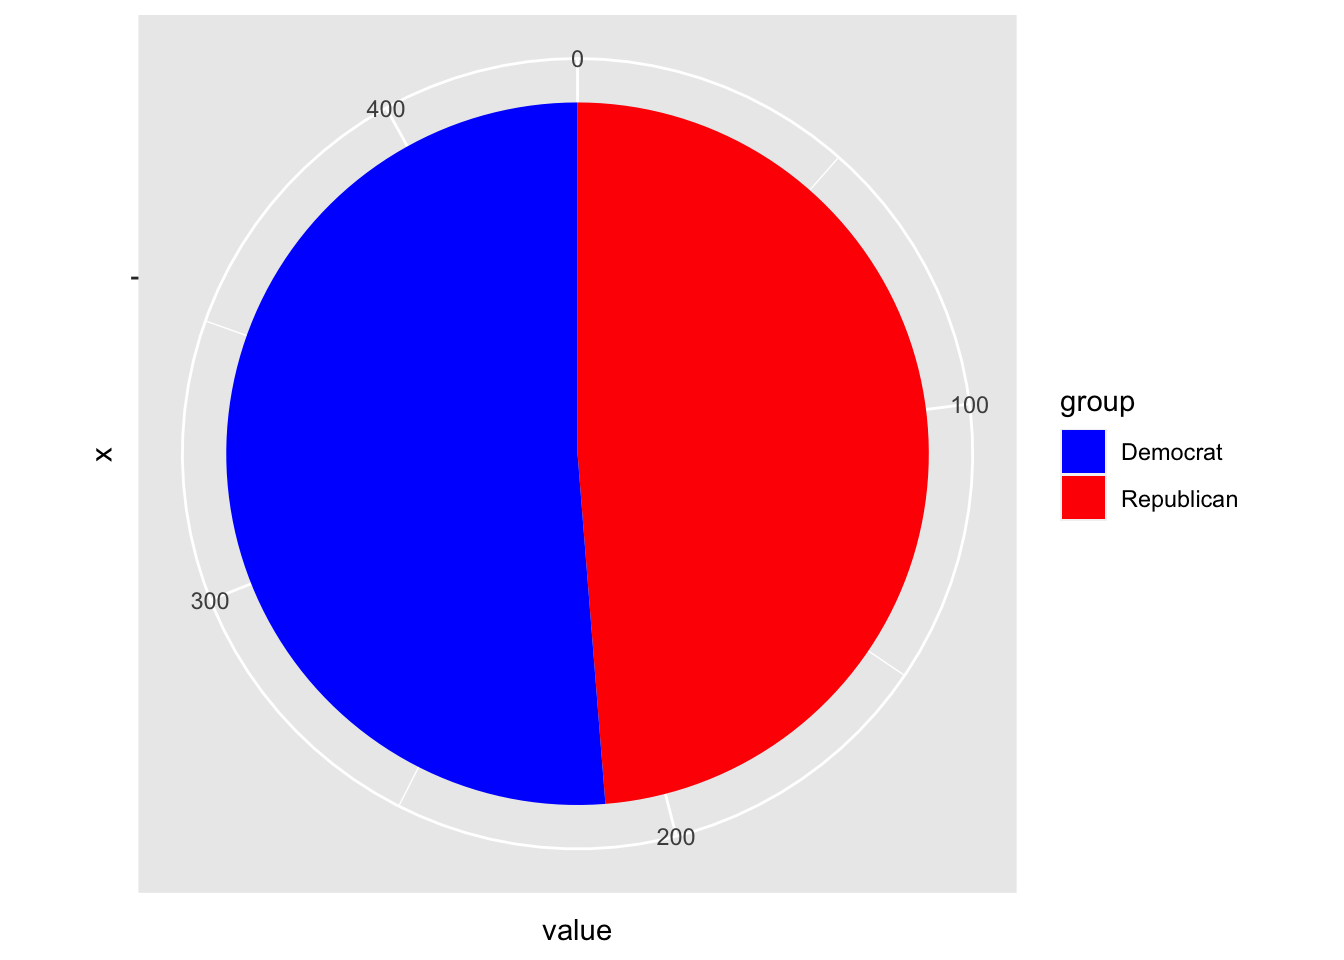 As you can see above, the 2022 prediction based on the 2018/2020 expert predictions accuracy gives the Democratic Party 223 seats, to the Republican Party’s 212. This would be a tremendous over performance for national Democrats, allowing them to EXPAND their House majority, relative to where it is today. This has rarely ever happened in the past 40 years, where typically incumbent parties LOSE control of one or both chambers in the U.S. Congress.
This model shows a completely different result than what we would expect – but there is likely reasons for this. Roe v Wade was overturned this Summer, which has proven to throw the Republican party into turmoil. Special elections, fundraising records, and polls have indicated a better national environment for Democrats than before the Supreme Court’s decision. Democrats now face a higher-than-normal opportunity at expanding control of the Senate & potentially maintaining control of the House. If this forecast shows anything, it tells us that this Roevember bump is very much expected.
However, with any out-of-ordinary prediction, it is very possible there is error that came with it. In this case, we should explore the limitations and potentially what is holding this model back from its full potential.
== Exploring Potential Limitations ==
When looking at how we predicted our 2022 elections based on the 2018 midterms, we fail to capture in the complexities of election analysis and prediction. Unfortunately for the Democrats, things aren’t as simple as using just 1 election as the basis for our prediction. We are not capturing in more than just 1 election of data, and thus, skews and flukes in this midterm will be calculated to be expected in 2022. This is not something we can treat as a traditional expectation, especially given 2018’s record breaking turnout + high Democratic Party vote share (nationwide). FiveThirtyEight even underestimated Democrats in 2018 – so expert ratings likely did as well. Unfortunately for the national Democratic Party, it may not be the case this time around.
Here is a list form of the limitations that could be contributing to the Democratic Party’s unexpected, shocking victory within this blog post.
- Not enough year to back up the forecast – by using 2018 data solely, we are limiting our ability to understand the election.
- We used only 3 different sources – unfortunately, only these 3 data sources had easily accessible data to pull for this blog post, so they were prioritized. However, they do not provide the universal input that one could hope for in a fine tuned model (given unlimited time + a work force behind them).
There are many other variables/factors to discuss in terms of inaccuracies as we use this model, but overall, I do trust the beliefs of the masses to some extent. I do believe that the expert forecasts are going to be more correct/closer to the eventual result as we add in more data. However, in this case, I do not trust the model’s output of 223D to 212R.
== Conclusion ==
Though I did not pursue with the traditional blog extension for this post, using the ending of the blog extension has given me a good amout of time to work on my final prediction. Building out my model has taken some time & finalizing on an expert forecast model is something that I only recently thought of. I am excited to see how accurate the final model is as I continue till election day. I’m looking forward to watching the results come in at the IOP! I believe that my model will adjust itself over the next week & come back more refined & accurate.
Thank you for taking the time to read this blog post :) Happy voting!
Nelson Bighetti
Professor of Artificial Intelligence
My research interests include distributed robotics, mobile computing and programmable matter.