Forecast of the 2022 Midterm Elections
Finally, the prediction
Hello everyone! My name is Ethan Kelly & as of writing this piece, I am a sophomore living in Leverett House, studying Government & Computer Science. In this final blog post, we will be exploring the 2022 midterm elections & my model for the congressional elections. This has been a product of an entire semester of studying various impacts on the outcomes of elections & I am excited to finalize my prediction just one day before the elections.
To begin, this model is based on forecast ratings from 3 major political forecast sources: The Cook Political Report, Larry Sabato’s Crystal Ball, and Inside Elections. All of these forecasters take into account various variables when it comes down to their predictions. Whether this be inflation, presidential approval, generic ballot, previous voting history, turnout expectations, GDP growth, among many, many others, they formulate their predictions into a system of ratings. This system works from Safe Democrat to Safe Republican. My model translates these ratings into a 7 point scale, which can be broken down in the following translation:
1 - Safe Democratic victory 2 - Likely Democratic victory 3 - Lean Democratic victory 4 - Pure toss-up 5 - Lean Republican victory 6 - Likely Republican victory 7 - Safe Republican victory
- One exception to this 7 point scale was Inside Election’s usage of Tilt characterizations (to which Tilt Democratic was 3.5 & Tilt Republican was 4.5)
The expert ratings utilized came from the past decade, 2012-2020. This was specifically chosen given the consistency of the congressional districts, while honoring a more-recent trend in hyper-partisanship across the nation. Additionally, these forecasters have been much more outward facing in recent time, rather than in a historical context. Essentially – the data only goes so far back. I acquired this data through the primary method of scraping the websites of the 3 major forecasters. To do this, the data required research across the Wayback machine (a website time traveler), though I also acquired data from a senior analyst at Larry Sabato’s Crystal Ball. To get the data necessary, I contact J. Miles Coleman via Twitter & received the Crystal Ball data from 2012-2020.
The procedure for this model came in the dataset, where the average was calculated of all of the forecast ratings & used as a general “average.” This average allows us to explore the combination of ratings, additionally avoiding toss-ups, as no district had all 3 ratings as “tossups.”
To see how accurate our model is, we are going to find the correlation between the expert ratings & Democratic party vote share. The decision to make this my model was rooted in the weeks of forecasts based on different outcomes in past blog posts. During one of the weeks, my partner (in class) Julia & I made a joint presentation on the risk of using expert predictions in a model. We talked about the risk of overfitting, as one may be taking into account a multitude of factors as they make a model that includes expert forecasts. Essentially, if Cook decides to use GDP growth in their forecast for house districts, then I make a model including both GDP growth & expert forecasts, I am account for a variable twice over.
Additionally, much of my work in political analysis is understanding the accuracy of these expert forecasters; organizations that make hundreds of thousands of dollars should have a pretty accurate prediction, right? Well, this is a question I am excited to find the answer to after tomorrow evening (or maybe Election Week 2.0)!
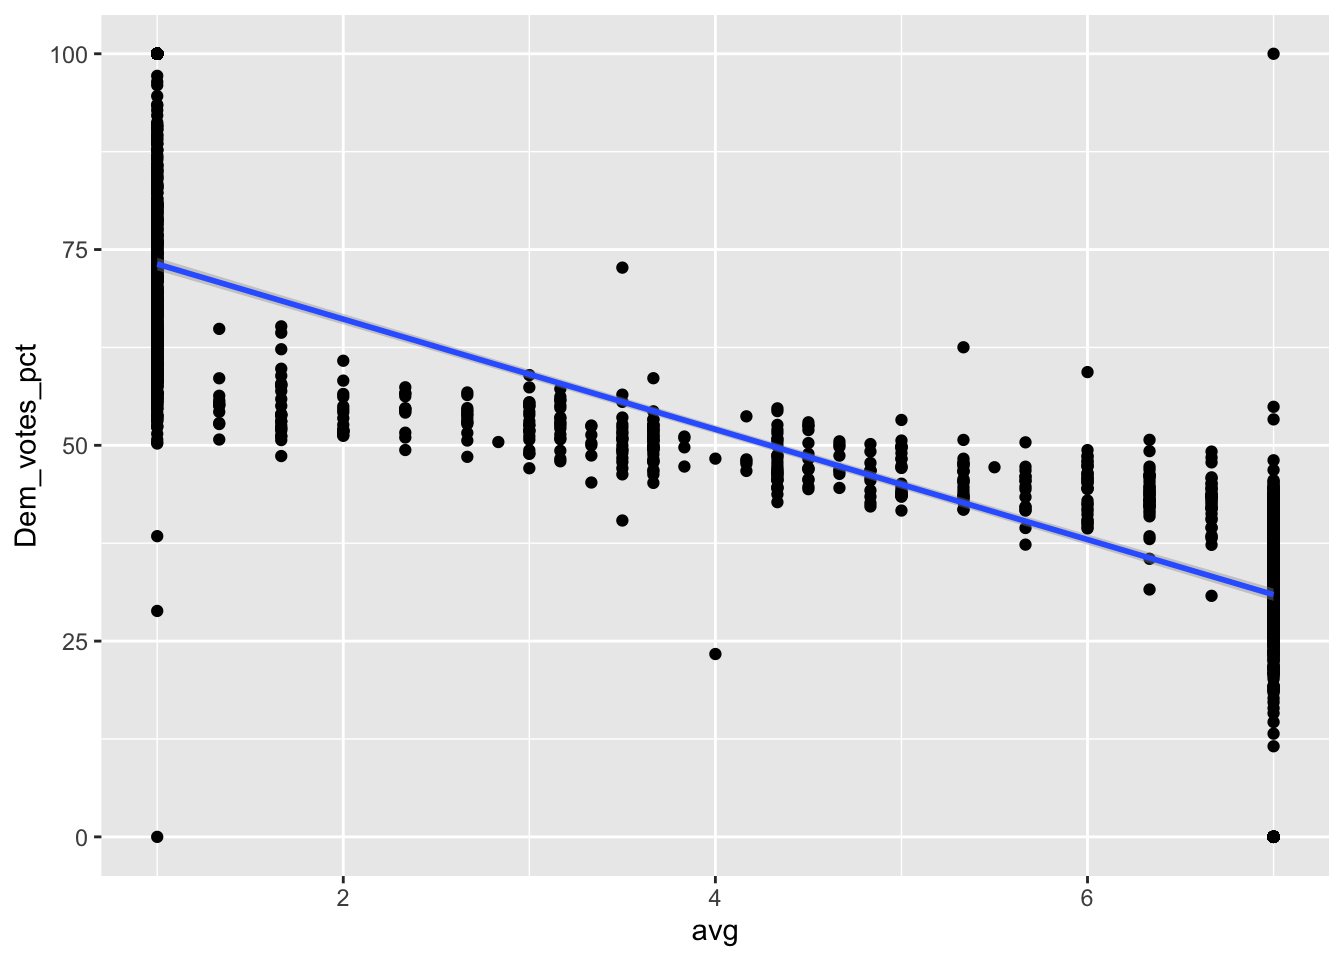
To begin in this forecast, we will be exploring the linear regression model between the past years plotted onto a graph.
## `geom_smooth()` using formula 'y ~ x'
As seen above, there is a clear correlation between the Democratic Party’s vote share & expert ratings across districts. The data points in that plot are a combination of the 2012-2020 congressional elections. To make this correlation most clear, we find the R-squared value to be 0.697. This shows a semi-strong correlation between the two variables, thus indicating that there is a signficant level of accuracy between the forecasts and the actual results.
There is only one coefficient, besides the constant, in this linear regression model – average rating. The summary of the model shows that as average rating goes up by 1, the expected Democratic Party voteshare decreases by 7%. This means, the closer we get to a Republican victory, the less Democrats end up getting in the final results. Makes sense!
Let’s move on to see what the predictions are saying across all of these forecasts.
== Predictions by Individual Expert Forecast ==
These models are all created by training an expert forecast model with data from 2012-2020. As mentioned previously, we have combined all of the expert ratings across historical & elections and compared the final Democratic Party vote share. For these models, we trained the linear regression model, then added in the new 2022 forecasts. Using its now-trained knowledge, it applied it to each of the districts with current ratings. Spoiler alert: this is the most uninteresting thing I’ve done so far for this prediction… sadly.
We begin with the Cook Political Report:
##        group value
## 1 Republican   215
## 2   Democrat   220
Based on the ratings from the Cook Political Report, we find quite a shocking result. When capturing in the ratings and accuracy of Cook & Democratic Party vote share, the R-squared value is 0.699, higher than the overall average, but not statistically different. As seen in the pie chart, the Democratic Party NARROWLY has the majority, with 220 seats to the Republican Party’s 215. This is a net decrease of 2 seats across the national map.
Let’s move onto Larry Sabato’s Crystal Ball:
##        group value
## 1 Republican   215
## 2   Democrat   220
How boring. We find in this model, the R-squared value is still significant, with it being 0.693. This is less than the Cook Political Report r-squared, but is still not statistically different from the prior model. As one can guess, this results in similar results, and we find an identical result of 220-215 seats (Democrats-Republicans).
Let’s see if Inside Elections changes anything:
## group value
## 1 Republican 215
## 2 Democrat 220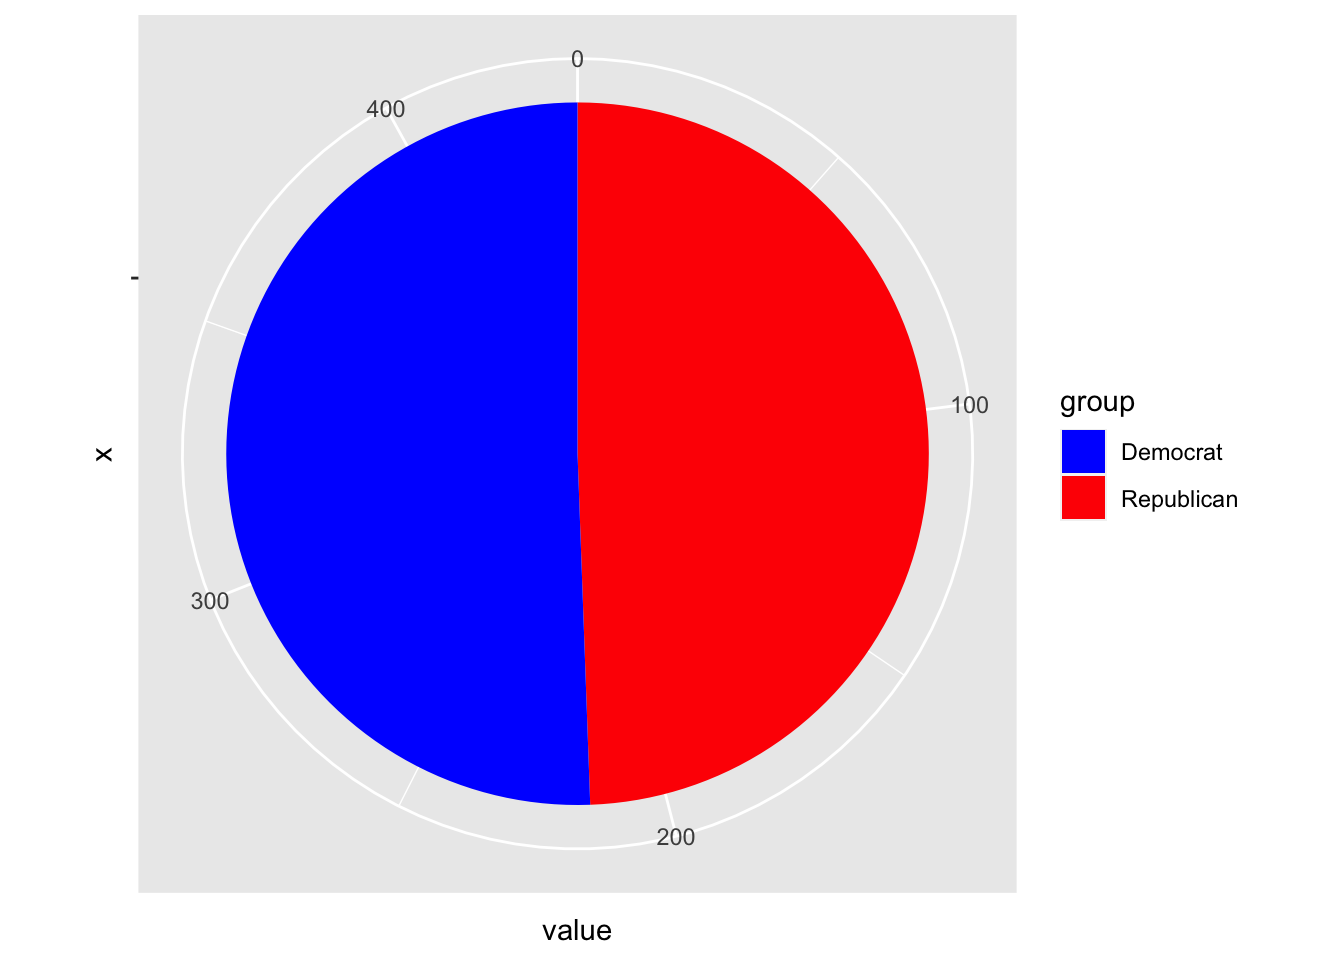 Of course… not. I promise you, when you go to the district-by-district ratings, there are differences in regards of percentage points. However, since we are not working with a 7 point scale on our actual results, the difference in outcome is not differeet across these 3 forecasters. In regards to Inside Elections, they find, again, an identical result of 220-215 (Democratic to Republican seats).
While we should not expect much, lets head into a 2022 combination model based on these expert forecasts.
== Conclusive Model ==
##
## 1 function (x, df1, df2, ncp, log = FALSE)
## 2 {
## 3     if (missing(ncp))
## 4         .Call(C_df, x, df1, df2, log)
## 5     else .Call(C_dnf, x, df1, df2, ncp, log)
## 6 }
As you can expect, the combination model turned up with exactly what all of the other models were telling us: 220 D - 215 R. This is not the result that I was expecting, but it is one that may be close to the actual result. As mentioned previously, the R-squared value of the model is 0.697. This is quite significant, though far from perfect. This result is shocking, to say the least, but there is a possibility for movement within the model. Let’s explore that next.
== Limitations, Model Validation, and Uncertainty Around My Prediction ==
This model, while not perfect, does shine a light a bit on how competitive these midterm elections truly are. The Democrats and Republicans are neck-and-neck in the national generic ballot, and numerous shifts have been happening left and rights. While I do not personally agree with the outcome, a 220-215 result may only be 20-30 seats off from the actual results. Let’s talk about some limitations that likely negatively impacted this model.
To begin, there was always going to be a limitation with our data on two fronts: utilize just 3 ratings websites & the time frame of which we compared ratings to results. In using Cook, Sabato, and Inside Elections, we find ourselves restricting the forecast to just 3 expert ratings. A simple Google search can show you tens of forecasters with established and respected sites – websites such as the Economist or FiveThirtyEight – all of them have a say in this election as well. By negating their input, we likely ended up with a more-inaccurate model. On top of this, we find that by only comparing ratings to results in the past 10 years, we are limiting our understanding of the accuracy of these predictions. Truly put – it would be much better to have 30-40 years of comparison, but these pundits have not even been around for that long. It would prove to be an impossible task, at least with all 3 of these forecasters, to date back before the 21st Century – even if it may prove to be heplful in this final forecast.
Other limitations may include inaccurate reporting of ratings – while I trust the sources I utilized for these expert forecasts, there is a possibility that some were misinterpreted, outdated, etc. The ratings were found directly from the official websites or from officials within these organizations, but this does not garuntee human error did not play a role. I hand-entered all of the ratings into a .csv to utilize for this project, and considering how these relationships are found in a linear regression model, it is possible a few errors could have completely thrown off the
As it pertains to uncertainty around my prediction, my predictive interval can be found here (it may not fully load without R loaded… Github is tricky to display this all):
## Rows: 435 Columns: 8
## ── Column specification ────────────────────────────────────────────────────────
## Delimiter: ","
## chr (4): district_id, cpr, inside_elections, crystal_ball
## dbl (4): cpr_num, inside_elections_num, crystal_ball_num, avg
##
## ℹ Use `spec()` to retrieve the full column specification for this data.
## ℹ Specify the column types or set `show_col_types = FALSE` to quiet this message.
## fit lwr upr
## 1 59.07461 33.771416 84.37781
## 2 30.92908 5.620342 56.23782
## 3 30.92908 5.620342 56.23782
## 4 30.92908 5.620342 56.23782
## 5 30.92908 5.620342 56.23782
## 6 30.92908 5.620342 56.23782
## 7 30.92908 5.620342 56.23782
## 8 73.14738 47.837934 98.45683
## 9 30.92908 5.620342 56.23782
## 10 30.92908 5.620342 56.23782
## 11 30.92908 5.620342 56.23782
## 12 30.92908 5.620342 56.23782
## 13 47.34731 22.044724 72.64989
## 14 45.00185 19.698885 70.30481
## 15 73.14738 47.837934 98.45683
## 16 63.76554 38.460923 89.07015
## 17 30.92908 5.620342 56.23782
## 18 45.00185 19.698885 70.30481
## 19 73.14738 47.837934 98.45683
## 20 30.92908 5.620342 56.23782
## 21 30.92908 5.620342 56.23782
## 22 30.92908 5.620342 56.23782
## 23 73.14738 47.837934 98.45683
## 24 37.96546 12.660365 63.27056
## 25 73.14738 47.837934 98.45683
## 26 30.92908 5.620342 56.23782
## 27 73.14738 47.837934 98.45683
## 28 73.14738 47.837934 98.45683
## 29 73.14738 47.837934 98.45683
## 30 63.76554 38.460923 89.07015
## 31 73.14738 47.837934 98.45683
## 32 73.14738 47.837934 98.45683
## 33 73.14738 47.837934 98.45683
## 34 54.38369 29.081240 79.68614
## 35 73.14738 47.837934 98.45683
## 36 73.14738 47.837934 98.45683
## 37 73.14738 47.837934 98.45683
## 38 73.14738 47.837934 98.45683
## 39 73.14738 47.837934 98.45683
## 40 73.14738 47.837934 98.45683
## 41 30.92908 5.620342 56.23782
## 42 73.14738 47.837934 98.45683
## 43 52.03823 26.735902 77.34056
## 44 30.92908 5.620342 56.23782
## 45 73.14738 47.837934 98.45683
## 46 70.80192 45.493932 96.10991
## 47 70.80192 45.493932 96.10991
## 48 49.69277 24.390397 74.99514
## 49 73.14738 47.837934 98.45683
## 50 73.14738 47.837934 98.45683
## 51 73.14738 47.837934 98.45683
## 52 73.14738 47.837934 98.45683
## 53 73.14738 47.837934 98.45683
## 54 73.14738 47.837934 98.45683
## 55 73.14738 47.837934 98.45683
## 56 73.14738 47.837934 98.45683
## 57 73.14738 47.837934 98.45683
## 58 73.14738 47.837934 98.45683
## 59 73.14738 47.837934 98.45683
## 60 73.14738 47.837934 98.45683
## 61 37.96546 12.660365 63.27056
## 62 37.96546 12.660365 63.27056
## 63 73.14738 47.837934 98.45683
## 64 73.14738 47.837934 98.45683
## 65 73.14738 47.837934 98.45683
## 66 45.00185 19.698885 70.30481
## 67 73.14738 47.837934 98.45683
## 68 59.07461 33.771416 84.37781
## 69 30.92908 5.620342 56.23782
## 70 56.72915 31.426411 82.03190
## 71 73.14738 47.837934 98.45683
## 72 73.14738 47.837934 98.45683
## 73 73.14738 47.837934 98.45683
## 74 73.14738 47.837934 98.45683
## 75 73.14738 47.837934 98.45683
## 76 33.27454 7.967183 58.58190
## 77 30.92908 5.620342 56.23782
## 78 30.92908 5.620342 56.23782
## 79 73.14738 47.837934 98.45683
## 80 63.76554 38.460923 89.07015
## 81 52.03823 26.735902 77.34056
## 82 73.14738 47.837934 98.45683
## 83 68.45646 43.149762 93.76316
## 84 73.14738 47.837934 98.45683
## 85 73.14738 47.837934 98.45683
## 86 56.72915 31.426411 82.03190
## 87 73.14738 47.837934 98.45683
## 88 30.92908 5.620342 56.23782
## 89 30.92908 5.620342 56.23782
## 90 30.92908 5.620342 56.23782
## 91 30.92908 5.620342 56.23782
## 92 33.27454 7.967183 58.58190
## 93 30.92908 5.620342 56.23782
## 94 33.27454 7.967183 58.58190
## 95 30.92908 5.620342 56.23782
## 96 73.14738 47.837934 98.45683
## 97 73.14738 47.837934 98.45683
## 98 30.92908 5.620342 56.23782
## 99 30.92908 5.620342 56.23782
## 100 37.96546 12.660365 63.27056
## 101 73.14738 47.837934 98.45683
## 102 37.96546 12.660365 63.27056
## 103 30.92908 5.620342 56.23782
## 104 30.92908 5.620342 56.23782
## 105 30.92908 5.620342 56.23782
## 106 30.92908 5.620342 56.23782
## 107 73.14738 47.837934 98.45683
## 108 30.92908 5.620342 56.23782
## 109 73.14738 47.837934 98.45683
## 110 73.14738 47.837934 98.45683
## 111 73.14738 47.837934 98.45683
## 112 73.14738 47.837934 98.45683
## 113 30.92908 5.620342 56.23782
## 114 40.31093 15.006705 65.61515
## 115 30.92908 5.620342 56.23782
## 116 30.92908 5.620342 56.23782
## 117 68.45646 43.149762 93.76316
## 118 30.92908 5.620342 56.23782
## 119 73.14738 47.837934 98.45683
## 120 73.14738 47.837934 98.45683
## 121 33.27454 7.967183 58.58190
## 122 73.14738 47.837934 98.45683
## 123 30.92908 5.620342 56.23782
## 124 30.92908 5.620342 56.23782
## 125 30.92908 5.620342 56.23782
## 126 30.92908 5.620342 56.23782
## 127 30.92908 5.620342 56.23782
## 128 73.14738 47.837934 98.45683
## 129 30.92908 5.620342 56.23782
## 130 73.14738 47.837934 98.45683
## 131 73.14738 47.837934 98.45683
## 132 42.65639 17.352879 67.95989
## 133 42.65639 17.352879 67.95989
## 134 47.34731 22.044724 72.64989
## 135 30.92908 5.620342 56.23782
## 136 30.92908 5.620342 56.23782
## 137 30.92908 5.620342 56.23782
## 138 73.14738 47.837934 98.45683
## 139 73.14738 47.837934 98.45683
## 140 73.14738 47.837934 98.45683
## 141 73.14738 47.837934 98.45683
## 142 73.14738 47.837934 98.45683
## 143 66.11100 40.805426 91.41657
## 144 73.14738 47.837934 98.45683
## 145 73.14738 47.837934 98.45683
## 146 73.14738 47.837934 98.45683
## 147 73.14738 47.837934 98.45683
## 148 68.45646 43.149762 93.76316
## 149 30.92908 5.620342 56.23782
## 150 59.07461 33.771416 84.37781
## 151 63.76554 38.460923 89.07015
## 152 30.92908 5.620342 56.23782
## 153 30.92908 5.620342 56.23782
## 154 54.38369 29.081240 79.68614
## 155 54.38369 29.081240 79.68614
## 156 30.92908 5.620342 56.23782
## 157 30.92908 5.620342 56.23782
## 158 30.92908 5.620342 56.23782
## 159 30.92908 5.620342 56.23782
## 160 30.92908 5.620342 56.23782
## 161 73.14738 47.837934 98.45683
## 162 30.92908 5.620342 56.23782
## 163 30.92908 5.620342 56.23782
## 164 30.92908 5.620342 56.23782
## 165 30.92908 5.620342 56.23782
## 166 56.72915 31.426411 82.03190
## 167 30.92908 5.620342 56.23782
## 168 30.92908 5.620342 56.23782
## 169 30.92908 5.620342 56.23782
## 170 73.14738 47.837934 98.45683
## 171 30.92908 5.620342 56.23782
## 172 30.92908 5.620342 56.23782
## 173 30.92908 5.620342 56.23782
## 174 30.92908 5.620342 56.23782
## 175 73.14738 47.837934 98.45683
## 176 30.92908 5.620342 56.23782
## 177 30.92908 5.620342 56.23782
## 178 30.92908 5.620342 56.23782
## 179 30.92908 5.620342 56.23782
## 180 73.14738 47.837934 98.45683
## 181 73.14738 47.837934 98.45683
## 182 73.14738 47.837934 98.45683
## 183 73.14738 47.837934 98.45683
## 184 73.14738 47.837934 98.45683
## 185 73.14738 47.837934 98.45683
## 186 73.14738 47.837934 98.45683
## 187 73.14738 47.837934 98.45683
## 188 73.14738 47.837934 98.45683
## 189 30.92908 5.620342 56.23782
## 190 73.14738 47.837934 98.45683
## 191 73.14738 47.837934 98.45683
## 192 73.14738 47.837934 98.45683
## 193 73.14738 47.837934 98.45683
## 194 63.76554 38.460923 89.07015
## 195 73.14738 47.837934 98.45683
## 196 73.14738 47.837934 98.45683
## 197 73.14738 47.837934 98.45683
## 198 54.38369 29.081240 79.68614
## 199 30.92908 5.620342 56.23782
## 200 30.92908 5.620342 56.23782
## 201 59.07461 33.771416 84.37781
## 202 30.92908 5.620342 56.23782
## 203 30.92908 5.620342 56.23782
## 204 73.14738 47.837934 98.45683
## 205 54.38369 29.081240 79.68614
## 206 56.72915 31.426411 82.03190
## 207 30.92908 5.620342 56.23782
## 208 42.65639 17.352879 67.95989
## 209 73.14738 47.837934 98.45683
## 210 73.14738 47.837934 98.45683
## 211 73.14738 47.837934 98.45683
## 212 35.62000 10.313858 60.92615
## 213 52.03823 26.735902 77.34056
## 214 73.14738 47.837934 98.45683
## 215 73.14738 47.837934 98.45683
## 216 73.14738 47.837934 98.45683
## 217 30.92908 5.620342 56.23782
## 218 30.92908 5.620342 56.23782
## 219 30.92908 5.620342 56.23782
## 220 73.14738 47.837934 98.45683
## 221 30.92908 5.620342 56.23782
## 222 30.92908 5.620342 56.23782
## 223 30.92908 5.620342 56.23782
## 224 73.14738 47.837934 98.45683
## 225 30.92908 5.620342 56.23782
## 226 30.92908 5.620342 56.23782
## 227 30.92908 5.620342 56.23782
## 228 30.92908 5.620342 56.23782
## 229 73.14738 47.837934 98.45683
## 230 30.92908 5.620342 56.23782
## 231 30.92908 5.620342 56.23782
## 232 45.00185 19.698885 70.30481
## 233 30.92908 5.620342 56.23782
## 234 63.76554 38.460923 89.07015
## 235 73.14738 47.837934 98.45683
## 236 30.92908 5.620342 56.23782
## 237 73.14738 47.837934 98.45683
## 238 30.92908 5.620342 56.23782
## 239 68.45646 43.149762 93.76316
## 240 30.92908 5.620342 56.23782
## 241 30.92908 5.620342 56.23782
## 242 30.92908 5.620342 56.23782
## 243 30.92908 5.620342 56.23782
## 244 30.92908 5.620342 56.23782
## 245 73.14738 47.837934 98.45683
## 246 49.69277 24.390397 74.99514
## 247 73.14738 47.837934 98.45683
## 248 30.92908 5.620342 56.23782
## 249 30.92908 5.620342 56.23782
## 250 49.69277 24.390397 74.99514
## 251 30.92908 5.620342 56.23782
## 252 56.72915 31.426411 82.03190
## 253 63.76554 38.460923 89.07015
## 254 73.14738 47.837934 98.45683
## 255 30.92908 5.620342 56.23782
## 256 68.45646 43.149762 93.76316
## 257 30.92908 5.620342 56.23782
## 258 68.45646 43.149762 93.76316
## 259 73.14738 47.837934 98.45683
## 260 45.00185 19.698885 70.30481
## 261 73.14738 47.837934 98.45683
## 262 73.14738 47.837934 98.45683
## 263 73.14738 47.837934 98.45683
## 264 73.14738 47.837934 98.45683
## 265 73.14738 47.837934 98.45683
## 266 70.80192 45.493932 96.10991
## 267 52.03823 26.735902 77.34056
## 268 68.45646 43.149762 93.76316
## 269 56.72915 31.426411 82.03190
## 270 30.92908 5.620342 56.23782
## 271 54.38369 29.081240 79.68614
## 272 59.07461 33.771416 84.37781
## 273 45.00185 19.698885 70.30481
## 274 40.31093 15.006705 65.61515
## 275 56.72915 31.426411 82.03190
## 276 59.07461 33.771416 84.37781
## 277 73.14738 47.837934 98.45683
## 278 73.14738 47.837934 98.45683
## 279 73.14738 47.837934 98.45683
## 280 73.14738 47.837934 98.45683
## 281 73.14738 47.837934 98.45683
## 282 73.14738 47.837934 98.45683
## 283 37.96546 12.660365 63.27056
## 284 73.14738 47.837934 98.45683
## 285 73.14738 47.837934 98.45683
## 286 73.14738 47.837934 98.45683
## 287 73.14738 47.837934 98.45683
## 288 73.14738 47.837934 98.45683
## 289 56.72915 31.426411 82.03190
## 290 59.07461 33.771416 84.37781
## 291 52.03823 26.735902 77.34056
## 292 73.14738 47.837934 98.45683
## 293 30.92908 5.620342 56.23782
## 294 52.03823 26.735902 77.34056
## 295 30.92908 5.620342 56.23782
## 296 30.92908 5.620342 56.23782
## 297 73.14738 47.837934 98.45683
## 298 73.14738 47.837934 98.45683
## 299 52.03823 26.735902 77.34056
## 300 30.92908 5.620342 56.23782
## 301 73.14738 47.837934 98.45683
## 302 30.92908 5.620342 56.23782
## 303 30.92908 5.620342 56.23782
## 304 30.92908 5.620342 56.23782
## 305 30.92908 5.620342 56.23782
## 306 30.92908 5.620342 56.23782
## 307 59.07461 33.771416 84.37781
## 308 30.92908 5.620342 56.23782
## 309 73.14738 47.837934 98.45683
## 310 30.92908 5.620342 56.23782
## 311 52.03823 26.735902 77.34056
## 312 30.92908 5.620342 56.23782
## 313 30.92908 5.620342 56.23782
## 314 30.92908 5.620342 56.23782
## 315 30.92908 5.620342 56.23782
## 316 30.92908 5.620342 56.23782
## 317 30.92908 5.620342 56.23782
## 318 30.92908 5.620342 56.23782
## 319 73.14738 47.837934 98.45683
## 320 30.92908 5.620342 56.23782
## 321 73.14738 47.837934 98.45683
## 322 59.07461 33.771416 84.37781
## 323 52.03823 26.735902 77.34056
## 324 54.38369 29.081240 79.68614
## 325 33.27454 7.967183 58.58190
## 326 73.14738 47.837934 98.45683
## 327 73.14738 47.837934 98.45683
## 328 73.14738 47.837934 98.45683
## 329 73.14738 47.837934 98.45683
## 330 70.80192 45.493932 96.10991
## 331 52.03823 26.735902 77.34056
## 332 52.03823 26.735902 77.34056
## 333 30.92908 5.620342 56.23782
## 334 30.92908 5.620342 56.23782
## 335 30.92908 5.620342 56.23782
## 336 68.45646 43.149762 93.76316
## 337 30.92908 5.620342 56.23782
## 338 30.92908 5.620342 56.23782
## 339 30.92908 5.620342 56.23782
## 340 30.92908 5.620342 56.23782
## 341 52.03823 26.735902 77.34056
## 342 73.14738 47.837934 98.45683
## 343 54.38369 29.081240 79.68614
## 344 30.92908 5.620342 56.23782
## 345 30.92908 5.620342 56.23782
## 346 30.92908 5.620342 56.23782
## 347 30.92908 5.620342 56.23782
## 348 30.92908 5.620342 56.23782
## 349 73.14738 47.837934 98.45683
## 350 30.92908 5.620342 56.23782
## 351 30.92908 5.620342 56.23782
## 352 30.92908 5.620342 56.23782
## 353 30.92908 5.620342 56.23782
## 354 30.92908 5.620342 56.23782
## 355 30.92908 5.620342 56.23782
## 356 35.62000 10.313858 60.92615
## 357 30.92908 5.620342 56.23782
## 358 30.92908 5.620342 56.23782
## 359 30.92908 5.620342 56.23782
## 360 73.14738 47.837934 98.45683
## 361 30.92908 5.620342 56.23782
## 362 30.92908 5.620342 56.23782
## 363 30.92908 5.620342 56.23782
## 364 30.92908 5.620342 56.23782
## 365 30.92908 5.620342 56.23782
## 366 30.92908 5.620342 56.23782
## 367 73.14738 47.837934 98.45683
## 368 30.92908 5.620342 56.23782
## 369 73.14738 47.837934 98.45683
## 370 30.92908 5.620342 56.23782
## 371 30.92908 5.620342 56.23782
## 372 30.92908 5.620342 56.23782
## 373 30.92908 5.620342 56.23782
## 374 30.92908 5.620342 56.23782
## 375 40.31093 15.006705 65.61515
## 376 73.14738 47.837934 98.45683
## 377 30.92908 5.620342 56.23782
## 378 73.14738 47.837934 98.45683
## 379 30.92908 5.620342 56.23782
## 380 73.14738 47.837934 98.45683
## 381 30.92908 5.620342 56.23782
## 382 30.92908 5.620342 56.23782
## 383 30.92908 5.620342 56.23782
## 384 30.92908 5.620342 56.23782
## 385 30.92908 5.620342 56.23782
## 386 30.92908 5.620342 56.23782
## 387 30.92908 5.620342 56.23782
## 388 56.72915 31.426411 82.03190
## 389 73.14738 47.837934 98.45683
## 390 73.14738 47.837934 98.45683
## 391 30.92908 5.620342 56.23782
## 392 73.14738 47.837934 98.45683
## 393 73.14738 47.837934 98.45683
## 394 54.38369 29.081240 79.68614
## 395 73.14738 47.837934 98.45683
## 396 30.92908 5.620342 56.23782
## 397 73.14738 47.837934 98.45683
## 398 30.92908 5.620342 56.23782
## 399 30.92908 5.620342 56.23782
## 400 30.92908 5.620342 56.23782
## 401 30.92908 5.620342 56.23782
## 402 30.92908 5.620342 56.23782
## 403 30.92908 5.620342 56.23782
## 404 52.03823 26.735902 77.34056
## 405 73.14738 47.837934 98.45683
## 406 73.14738 47.837934 98.45683
## 407 30.92908 5.620342 56.23782
## 408 30.92908 5.620342 56.23782
## 409 56.72915 31.426411 82.03190
## 410 73.14738 47.837934 98.45683
## 411 30.92908 5.620342 56.23782
## 412 66.11100 40.805426 91.41657
## 413 73.14738 47.837934 98.45683
## 414 73.14738 47.837934 98.45683
## 415 73.14738 47.837934 98.45683
## 416 73.14738 47.837934 98.45683
## 417 42.65639 17.352879 67.95989
## 418 30.92908 5.620342 56.23782
## 419 30.92908 5.620342 56.23782
## 420 73.14738 47.837934 98.45683
## 421 73.14738 47.837934 98.45683
## 422 54.38369 29.081240 79.68614
## 423 73.14738 47.837934 98.45683
## 424 73.14738 47.837934 98.45683
## 425 30.92908 5.620342 56.23782
## 426 73.14738 47.837934 98.45683
## 427 40.31093 15.006705 65.61515
## 428 73.14738 47.837934 98.45683
## 429 30.92908 5.620342 56.23782
## 430 30.92908 5.620342 56.23782
## 431 30.92908 5.620342 56.23782
## 432 30.92908 5.620342 56.23782
## 433 30.92908 5.620342 56.23782
## 434 30.92908 5.620342 56.23782
## 435 30.92908 5.620342 56.23782- These seemingly are numbered by alphabetical & numeric order (i.e. 1 is Alaska At-Large, 8 is Alabama-07, etc.).
As you can see, there is QUITE a significant lower and upper interval within these predictions. As we talk about limitations, this likely drives the reason why there is high uncertainty. With just 5 elections to base accuracy off of, it is very possible that the predictions could be wildely off from what is expected. If we were to consider the upcoming midterms as a potential fluke elections, we could see results close to the lower & upper levels of Democratic Party vote share.
Altogether, there is much that could be improved upon given the proper resources (or potentially 10-20 years in the future). The problem with this project being conducted now is the limited data and limited understanding (in the modern age) of political data on a congressional level. Moving forward, I hope to update this forecast in 2024, with additional time to bypass some of the limitations, cross check data, and more.
== Conclusion ==
In conclusion, the model finds a results that would probably get any political pundit in trouble if they were to publish it. This means – I am counting on being wrong after tomorrow. But who knows? This model was focused on seeing how accurate & knowledgable the political predictors were when it came down to congressional races, and honestly, I expected more Republican seats than what we have. Though, because of the high uncertainty and high levels of difference between the lower and upper bounds, there is still A LOT of wiggleroom for Democrats and Republicans in these races.
Though this model predicts a Democratic majority, the Democratic Party can still likely expect to lose the midterm elections. The good thing about the human voice behind a model such as this one, is that I recognize this model will likely be wrong. I am looking forward to reflecting onto the accuracy of this model (in a sense, a combination of other models, variables, etc.).
Thank you so much for taking the time to read my final forecast – let’s see what happens :).
Nelson Bighetti
Professor of Artificial Intelligence
My research interests include distributed robotics, mobile computing and programmable matter.