Post-Election Reflection on Model
== Post-Election Reflection on Model ==
Hello everyone! After such an incredible campaign and midterm season, we are finally, finally over. However, our discussion of the 2022 midterms is far from over! In this blog post, we will be discussing the accuracy of my model & my reflection on it. The 2022 midterms were quite exciting – so let’s get into it!
To provide context, the idea for this model was birthed out of a rotation of predictive models based on various factors; whether GDP growth, generic ballot, incumbency, expert forecasts, etc. However, one model in particular jumped out to me: expert forecasts. A model based on expert forecasts enticed me, as it combined all of the factors we aimed to compute and utilize in our forecast, simplifying it into terms of Lean, Likely, and Safe characterizations. I felt it would be fascinating to predict the midterms based on expert forecasts & it absolutely was. Let’s look at it!
== Recap of my model ==
My model utilized forecasts from 3 main political companies: the Cook Political Report, Larry Sabato’s Crystal Ball, and Inside Elections. These election forecast companies have been around for years & have been predicting congressional, presidential, and gubernatorial elections since the beginning of the 21st Century. The reasoning behind choosing these factors were due to the fact that these companies are some of the most frontward facing & they provide more transparency about their decisions behind the models. Ultimately, I felt these would be the most helpful when predicting the midterm elections.
With these 3, each rating provided by the company would be turned into a respective number. These numbers were based on a scale of 1-7, with 1 being the most Republican & 7 being the most Democratic.
Here it is:
1 - Safe Democratic victory 2 - Likely Democratic victory 3 - Lean Democratic victory 4 - Pure toss-up 5 - Lean Republican victory 6 - Likely Republican victory 7 - Safe Republican victory
The 3 separate ratings were averaged & distributed back across the 2022 districts.
The model’s creation, in addition, was created in a similar way. These ratings for each 435 districts were averaged in elections from 2012-2020, with a new variable added in a column: Democratic Party vote share. Essentially, we ran a regression to find the connection between ratings & the Democratic Party’s performance in past elections – we then used that model to predict 2022 based on historical accuracy.
## `geom_smooth()` using formula 'y ~ x'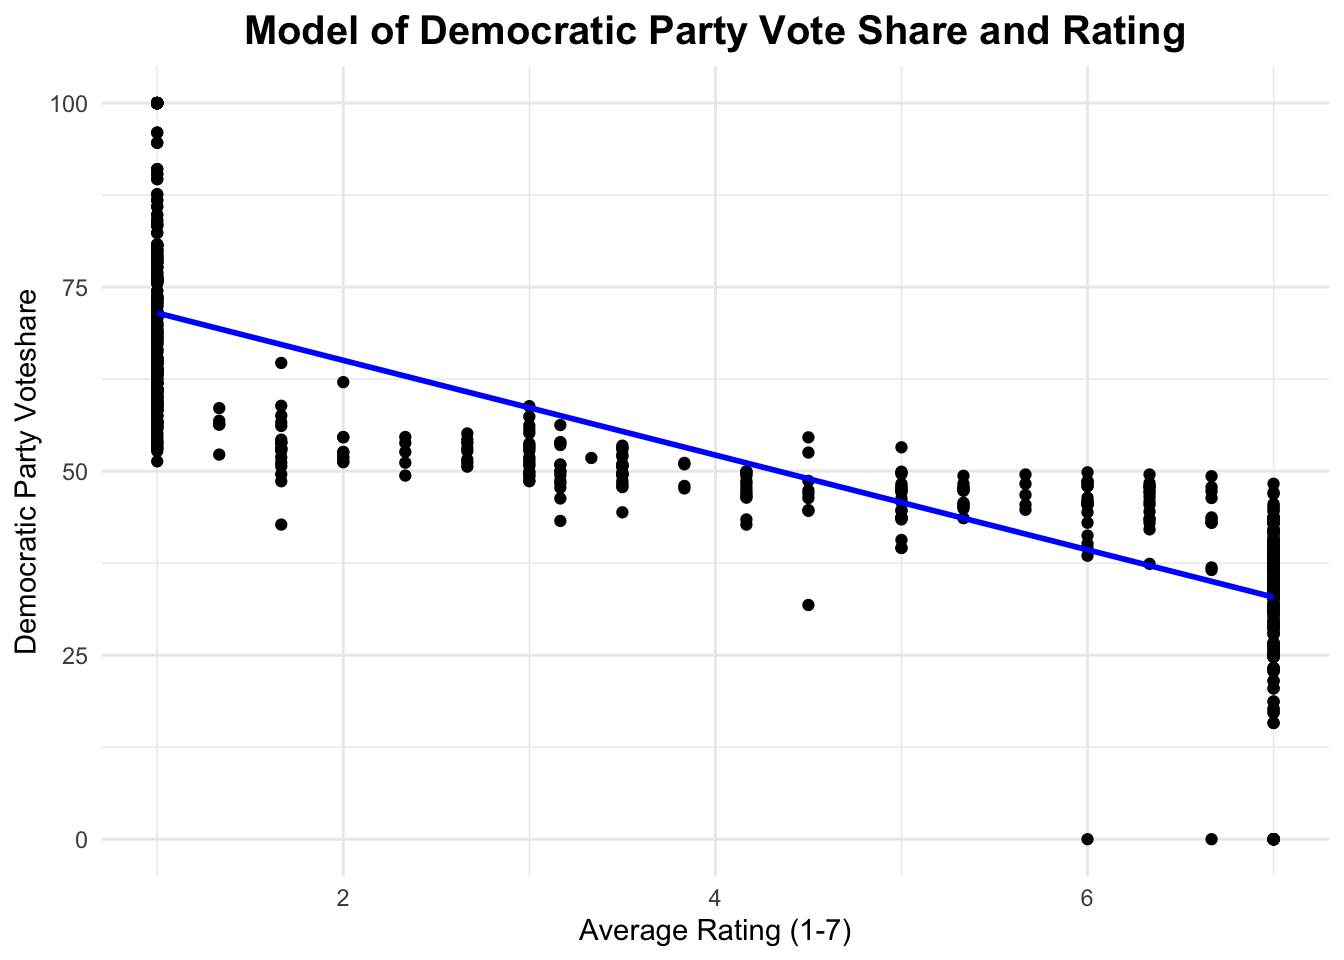
Our predicted result for the 2022 midterms resulted in an expected Democratic Majority of 220 seats, to the Republican Party’s 215. This would be a loss of 2 seats for Democrats, and a gain of 2 for Republicans. This result was, plainly put, shocking. Democrats have been the underdogs in this race since November 7th, 2020, when President Joe Biden was the predicted winner of the 2020 election. Democrats held the slimmest majority in the 21st Century, yet ultimately were being predicted to win the race by my model. You can see it visualized below.
##        group Predicted_Results
## 1 Republican               215
## 2   Democrat               220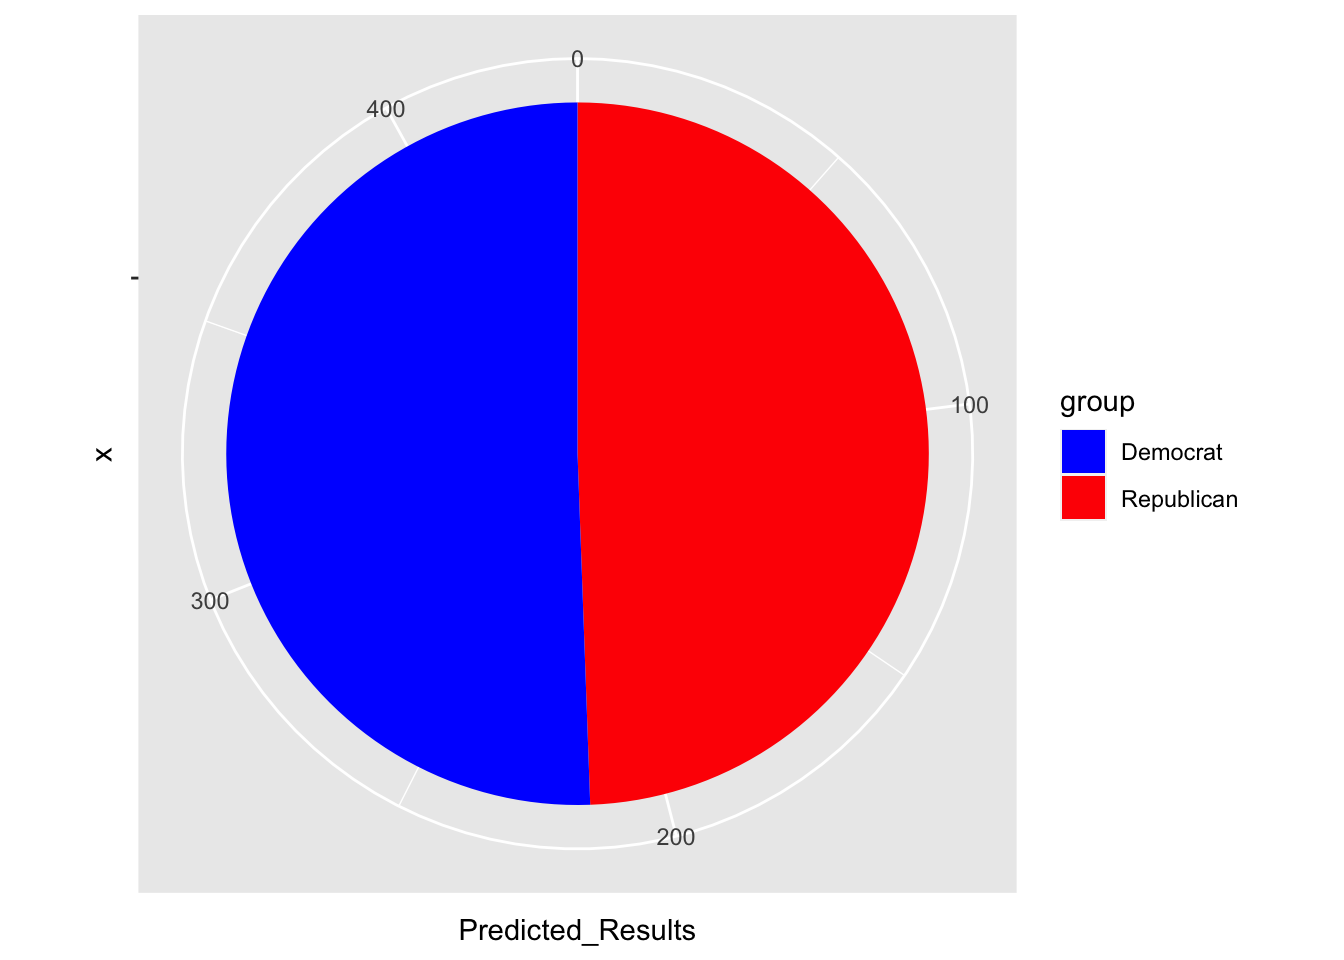
When I saw the results, I was quite shocked. It made no sense. This model, in my eyes, was not going to be accurate. However, let’s look at the actual results, as I was even further surprised.
##        group Current_House_Composition
## 1 Republican                       222
## 2   Democrat                       213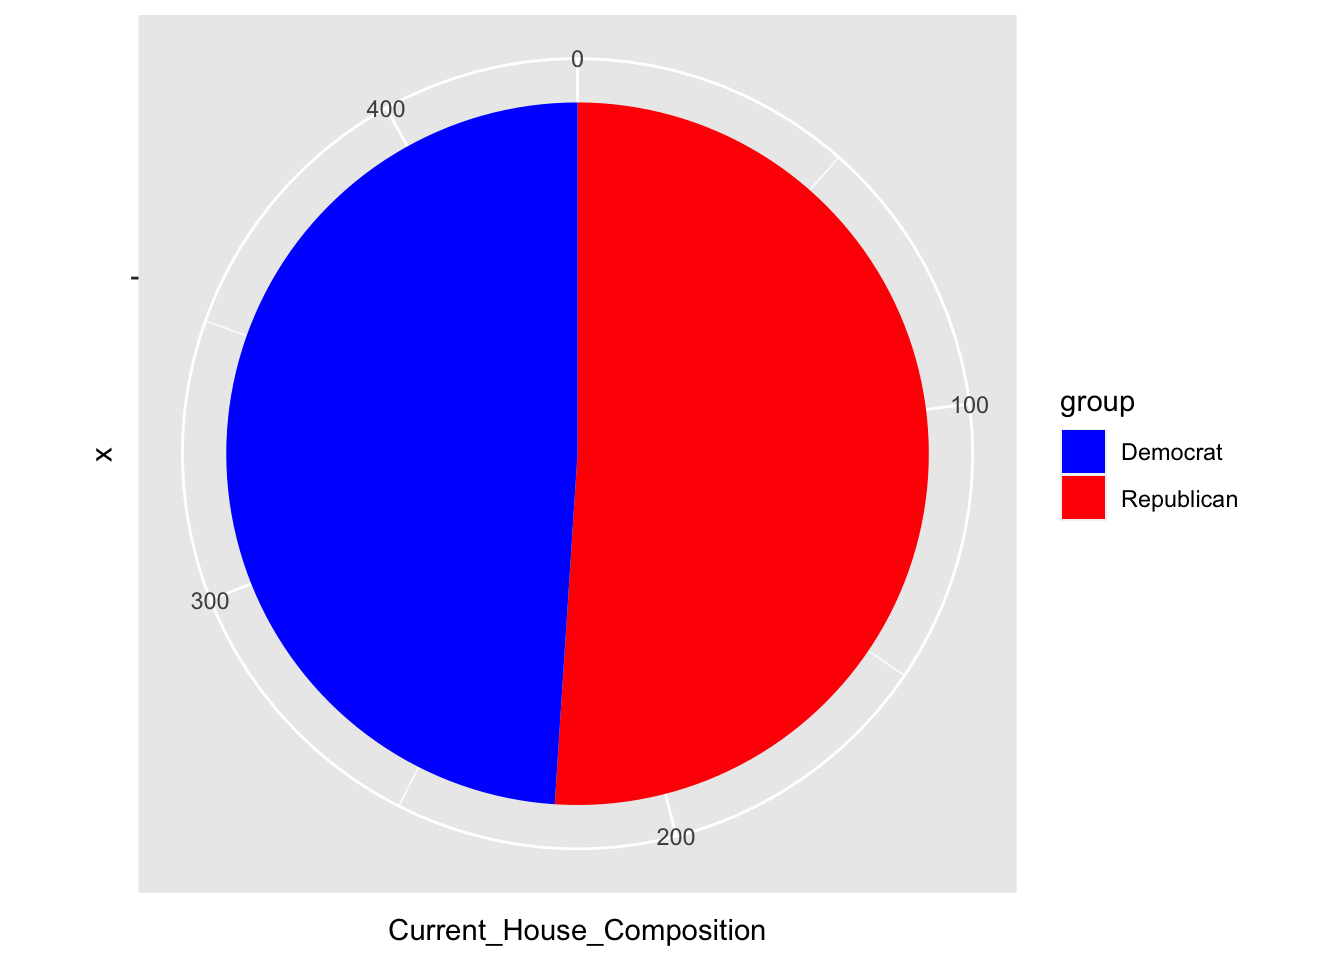
The results of the 2022 midterms (assuming all those leading in races end up winning) will be a mirrored flip of the 2020 House election results: Republicans at 222, and Democrats at 213. As an aside, this is exactly what happened from 2016 - 2020 in the presidential election in the electoral college (just thought this was cool).
In terms of individual races, the model based on expert forecasts ended up inaccurately predicting just 4% of House races (17 races). The model ended up correctly predicting 418 out of 435 districts ~ about 96.1% accuracy. Plainly put – the model itself was quite accurate and ended up only being off of the actual results by 17 individual races, but on the overall net of just 8 seats!
To gauge a further level of accuracy, we will be exploring the Root Mean Square Error of the prediction vs. the observation (the result).The RMSE was calculcated by figuring out the difference between predicted Democratic Party vote share and actual Democratic Party vote share. This led us to the RMSE os 0.1202, which I rounded to 0.12. This is not that bad – this is not what I expected when I found out I was one of TWO people in the class who predicted a Democratic majority. Though the 12% error, on the topic of accuracy, I’d argue that my model was quite accurate, even if I did not think it would be on election day.
Some interesting things about accuracy with this forecast (worth mentioning… at least): 1. All of the inaccuracies occured in states that are consider “East Coast (including PA)” or “West Coast.” None of “Middle America” was predicted wrong by these forecasts. 2. A large sum of the inaccuracies came from very populous states: New York + California 3. The model had only a 55% success rate in predicting the house races in Virginia (the least correct state… by far) 4. Contrary to what forecasting sites, such as FiveThirtyEight and The Economist, said, the model was very accurate in some extremely competitive races (in NC, IA, AZ, NV, etc.) 5. About equal number of districts were overestimated for Democrats & Republicans
Now that we’ve talked accuracy, let’s move onto what could have impacted the model’s accuracy!
== What went wrong, how to check, and what to improve ==
My model was not perfect. Though I wish it was, there are some parts of the model (also dealing with the underlying variables that contributed the expert forecasts) that could be weighing down the accuracy of the model.
One source of error could be the fact the model was only utilizing Cook, Sabato, and Inside Election. This could have limited the predictive ability of experts across the board, as we failed to include other pundits and their ratings (even some notable ones: FiveThirtyEight, The Economist, RealClearPolitics, etc.). To test if this was one of the determining reasons as to why the model was inaccurate, we could create another model with more forecasters & compare predicted seat share vs. prior-predicted seat share. We can see if the RMSE is significantly different and/or if the seat share is more accurate by %. These quantitative tests would provide us clarity as to whether the beliefs of the masses are more accurate than the big 3.
Another source of error could be that our model was predicting based on only 5 years of data to compare. In using 2012-2020, we had the luxury of working with the same congressional districts in a more-modern timeframe of the 21st Century. It provided us similar conditions that we could expect for 2022, but it also could have been to our detriment. By using only 5 years, it is very possible that these forecasts were incorrect in previous years, thus making it incorrect for 2022. Additionally, we found that the model had a left-ward bias – this is something that could be a product of working with such a few years (especially when 2016 & 2020 threw off so many political pundits). If we want to apply a quantitative test, we could re-do the linear regression model & create a model using singular years. An example would be a 2022 midterm model based on 2018 accuracy. This would allow us to compare to see which was the most D-leaning, R-leaning, etc! After that, we can see which year ended up being the most accurate.
Another major factor that likely led to inaccuracies in this cycle is redistricting. This election cycle is very different from the past few that have been utilized in our model. This one is brand new – new districts, new candidates, new environment. Consequently, it is very possible that pundits are not going to be as accurate in this year’s prediction, as they may be in 2024, 2026, etc. when the new boundaries have more data behind them. While this would not be a perfect way to approach testing redistricting as something that can be fixed, we could compare 2012 accuracy vs 2014, or (in the future) 2022 vs 2024. Potentially, more data behind the new districts could benefit the forecasting process & thus future models similar to mine. The second-to-last error I’d mention, briefly, is human error. There is a possibility that this model had data that was incorrectly input/compiled, and thus could alter the outcome of the model.
Ending on this note, one major factor we always should consider when reflecting on 2022 models is that 2022 was a bad year for polling, turnout modeling, etc. There were significant levels of inaccuracies in district-by-district polls this cycle, on top of inaccuracies in turnout models. Altogether, this year was not perfect & the data that these expert forecasters were using was also not perfect. While there is no quantitative test to see if the “incorrectness” of an election year has impacted the model, it is something to keep in mind. The data the experts were using was thrown off by the Roe v Wade effect, shifting approvals for Republicans, and important top-ballot races that were more dominating than the congressional ones.
Now, let’s talk about…
== What I’d do differently ==
If given the opportunity to expand on my model with more time & resources, I would approach certain aspects of it differently.
To begin, I would move to add in additional forecasts from what I currently have. I would like to add in 5-10 more networks/companies to help increase accuracy. The problem with just 3 meant that the room for error was more significant. Additionally, since we were averaging all 3 ratings, they were not always in close proximity. Some ratings of the same district were Likely R while others had a Toss-Up characterization. Issues such as that could skew the results & significantly throw off the average, unlike a model with significantly more forecasts.
Next, I would source for more historical data. Time permitting, I would absolutely scrape and look back at historical ratings well beyond 2012. Many forecasters have been predicting elections for decades & the model would stand to gain by having more history added into it. This could help ensure that there is no recency bias or recent inaccuracies significantly altering our results/expectations for both parties.
Finally, I would aim to adjust for prior mistakes by these forecasters. Taking into account data on a year-by-year basis, I would focus on recognizing D-leaning and R-leaning years. This would mean adjusting for inherent bias in the ratings once we have compiled the results (easily done for years past), and apply a bias-correction to the model itself, hopefully avoiding any consistent, prevalent bias that we recognize.
== Conclusion ==
Overall, the model of expert forecasts proved to be more accurate than I expected. Though the model was off by about 7 seats (net), this is closer than other models were. Some pundits who are paid tens of thousands of dollars predicted worse than my model – so ultimately, I am happy with it. While there is much to improve upon in the future, I truly enjoyed working with the model of the past 2 weeks & reflecting on the results. If there’s one thing this midterm proved: anything is possible.
Thank you for taking the time to read my reflection :)
Peace out!
Nelson Bighetti
Professor of Artificial Intelligence
My research interests include distributed robotics, mobile computing and programmable matter.